
SAT Exam Hub
How to Read the '1 in 4 NFL Players CTE' Study
The '1 in 4 NFL players has CTE' headline is real, but the figure is a minimum prevalence estimate at death in a brain-donor sample — not a risk number for living players. This explainer for health and science classes covers what the 2026 BMJ study measured and how to apply a four-check framework to any medical headline.
- gre
- mcat
- asvab
- sat
- act
- digital-adaptive
- official-material
- section-strategy
- test-date-timeline
Put the headline “1 in 4 NFL players has CTE” on a health-class screen, and the first question should be immediate: One in four of whom?
Evidence label: This article examines a peer-reviewed retrospective population-based cohort study published in The BMJ on August 25, 2026. Last reviewed against the study on August 27, 2026.[1]
The compact, accurate finding is this: among former NFL players who died during 2016–21, confirmed diagnoses from donated brains established a minimum CTE prevalence at death of 24.5%. Because most brains were not examined, the study’s possible range extended as high as 97.7%.[1] The lower figure is consequential, but neither end of that range predicts whether a living player has or will develop CTE.

Chronic traumatic encephalopathy, or CTE, is a brain disease characterized by abnormal tau pathology. At present, it can be definitively diagnosed only by examining brain tissue after death.[2] That diagnostic boundary controls what the study can—and cannot—tell us.
Follow the denominator from 1,712 deaths to 338 brains
The study began with 1,712 former NFL players who died from 2008 through 2021. Researchers obtained and studied donated brains from 338 of them, or 19.7% of the full group. Neuropathologists diagnosed CTE in 315 of those 338 brains, producing the striking donated-brain percentage of 93.2%.[1]
| Study group | Number or estimate | What it represents |
|---|---|---|
| Former NFL players who died, 2008–21 | 1,712[1] | The full-period decedent cohort |
| Brains donated and examined | 338, or 19.7%[1] | The subset with tissue available for diagnosis |
| Examined brains diagnosed with CTE | 315 of 338, or 93.2%[1] | Observed prevalence within the donor subset |
| Former NFL players who died, 2016–21 | 878[1] | The narrower denominator used for the headline estimate |
| Possible CTE prevalence at death, 2016–21 | 24.5%–97.7%[1] | Bounds reflecting unknown CTE status among unexamined brains |
The 93.2% and 24.5% figures can both be correct because they use different denominators. The first asks, “Among the donated brains that researchers could examine, what proportion had CTE?” The second asks, “What minimum proportion of all identified former NFL players who died in the relevant period can be confirmed to have had CTE?”
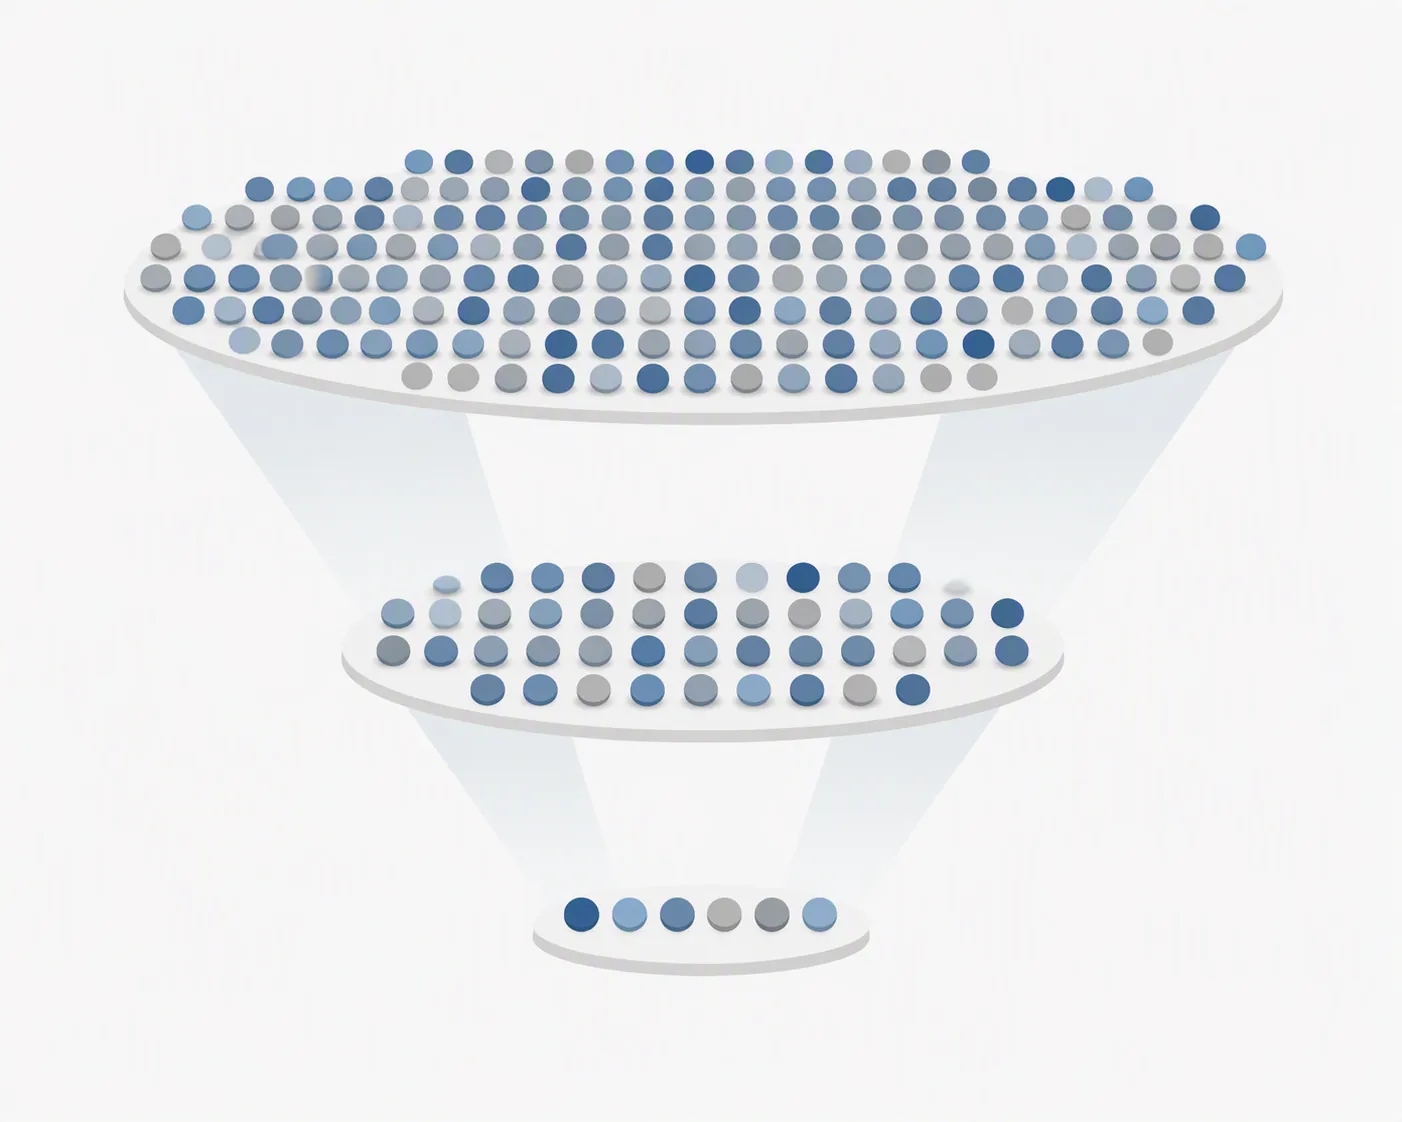
A minimum bound treats every person without an examined brain as though that person did not have CTE. That assumption is intentionally conservative: it gives the lowest prevalence consistent with the confirmed diagnoses. The upper bound makes the opposite extreme assumption about the unexamined cases. For the entire 2008–21 cohort, the study reported corresponding bounds of 18.5%–98.7%; for the more recent 2016–21 period, the bounds were 24.5%–97.7%.[1]
This does not mean every value in either interval is equally likely, and the midpoint is not automatically the best estimate. The range displays what remains unknown when diagnoses are available for only part of the cohort. “At least one in four” reports the defensible floor. It should not be shortened to “the risk is one in four.”
Why the donated brains cannot simply stand in for everyone
Brain donation did not produce an interchangeable miniature of the full cohort. Compared with non-donors, donors had longer playing careers and more Pro Bowl selections and Hall of Fame inductions.[1] Those observable differences are direct evidence that entry into the examined sample was selective.
That is selection bias in a concrete form. If the people whose brains become available differ systematically from those whose brains do not, the percentage inside the donor group may not equal the percentage in the full population. The 93.2% result is a valid description of the examined brains; the mistake would be copying it directly onto all former players.
The researchers used inverse probability weighting to address measured differences between donors and non-donors.[1] In simplified terms, this method adjusts how much influence observed donors receive according to their probability of appearing in the sample. It attempts to make the analyzed information better reflect the larger cohort on characteristics available to the researchers.
Weighting is an adjustment, not a device for reconstructing every missing brain. It can account for recorded factors included in the model, but it cannot guarantee correction for unmeasured differences connected with donation or disease. That is why the study reports bounds rather than pretending that the missing diagnoses have been observed.
Other safeguards addressed different problems. Neuropathological assessments used NIH/NIBIB criteria and were masked to clinical information, while dementia adjudication was masked to the neuropathology findings.[1] Masking reduces the opportunity for knowledge in one part of the assessment to influence judgment in another. It strengthens the measurement process, but it does not erase the donor-selection problem; methodological protections are specific to the bias they were designed to reduce.
A four-check reading exercise
The following is a suggested classroom checklist synthesized from the paper’s methods and limitations, not a formally named scientific framework. Its value is that each question forces a headline back toward the evidence that produced it.
| Check | Application to the BMJ study |
|---|---|
| Identify the denominator | 93.2% uses 338 donated brains; the 24.5% floor uses all 878 identified former NFL player deaths during 2016–21.[1] |
| Inspect who entered the sample | Only donated brains could be diagnosed, and donors differed from non-donors in career length and selected football honors.[1] |
| Name the quantity being measured | The result describes CTE prevalence at death, not the future risk faced by a living player. |
| Separate association from causation | The study can report relationships between CTE stage and dementia, but an observed relationship alone does not prove that one caused the other. |
Prevalence at death is not an individual forecast
Prevalence asks how common a condition is in a defined population at a specified point or period. Here, the relevant condition was confirmed in brain tissue after death. The study therefore describes disease present at death among a cohort of deceased former players, with uncertainty created by the many brains that were not available.
An individual risk prediction asks a different question: what is the probability that a living person will develop or possess the condition? Answering that would require evidence capable of connecting present characteristics and future outcomes in living people. Because CTE currently has an autopsy-only definitive diagnosis, this study cannot determine which living players have it or assign them a personal probability.[2]

This distinction does not make the finding unimportant. Confirming CTE in many studied brains matters to former players and families dealing with dementia or suspected brain disease, and a minimum prevalence of 24.5% at death is substantial enough to warrant careful attention. Respecting that human importance does not require converting a population bound into a prediction the research did not make.
Read the dementia result as an association
The study reported an association between stage IV CTE and dementia, with a risk ratio of 1.44 and a 95% confidence interval of 1.16–1.78.[1] In a study question, “associated with” is the phrase to preserve. The ratio and interval quantify the observed relationship under the analysis; they do not by themselves establish that stage IV CTE caused every dementia case or rule out other contributing factors.
How dementia was measured also matters. Compared with the study’s adjudication process, death certificates missed 69.3% of dementia cases.[1] A student who looked only at the certificate data would therefore be working with a measure that omitted many cases identified by the study. This is a measurement lesson, not permission to substitute assumptions for records: first ask how an outcome was defined, then ask how consistently that definition was applied.
Rewrite the headline without losing the finding
A defensible rewrite would be: “Among former NFL players who died in 2016–21, confirmed autopsy diagnoses established that at least 24.5% had CTE at death; because most brains were not examined, the study’s possible range extended to 97.7%.”
That sentence is longer than “1 in 4 NFL players has CTE” because the missing nouns carry the study’s meaning: former players, deaths, autopsy diagnoses, prevalence at death, minimum bound. The shorter headline can prompt curiosity, but it should not replace those qualifications in a class discussion, exam response, or explanation to someone deciding what the number says about a living person.
For another example of translating fresh research into exam reasoning, see how ancient DNA from cave walls helps you study for exams. The evidence-label approach also appears in the analysis of whether mindfulness exercises improve study focus, while students applying the same source-reading habits to test preparation can use the existing guide to choosing SAT practice questions by difficulty.
Applied here, the four checks leave a precise conclusion: “1 in 4” is a defensible floor for CTE prevalence at death in the study’s former-player cohort and period. It is not a point estimate for all NFL players, and it is not an individual risk prediction for anyone living today.
References
- Prevalence of chronic traumatic encephalopathy at death in National Football League players: retrospective population based cohort study, 2008-21, The BMJ, 25 August 2026
- What is CTE?, Concussion & CTE Foundation
Related exhibits & inventory
Verified outcomes
- not-score-proven → not-score-proven
When to Do HIIT for Better Memory and Exam Focus
- No baseline score reported → No verified final scoreLimited
Can NYT Strands Daily Actually Build Vocabulary?
- pre-final grades → 0.65 SD higher
A Sleep-First Routine to Stop Falling Asleep While Studying
- Not a score log → Not a score logModerate
Does Air Quality Affect Study Focus? Yes — by How Much?
Planners
Tool verdicts
A lesson substitute only for motivated adult beginners with MIDI keyboards focused on songs; otherwise a supplement.
Monthly $19.99; 6-month $83.94; annual ~$119.88-$120; checked 2026-08-27EvidenceModeratePixel 11 Pro is the cheaper study-app buy for flashcard-heavy students; iPhone 17 Pro only for notes-first Apple users.
$1,099/256GB each; AnkiMobile $24.99 iOS vs AnkiDroid free; checked 2026-08-26EvidenceModerateGalaxy S26 Ultra offers the more complete out-of-box exam-prep workflow; Pixel 11 Pro suits students who prefer assembling their own study stack.
Pricing not included in this workflow comparison (2026-08-26)EvidenceModerate
Questions about this plan
Ask a question about a specific section, timeline, or citation in this plan — or flag something that needs correcting.
Comments
Join the discussion with an anonymous comment.