
ACT Exam Hub
How Monarch Migration Tracking Actually Works
Monarch migration is tracked through four very different methods — physical tagging, volunteer sightings, hectare-based winter censuses, and navigation experiments — each answering a different question. This guide shows students how to judge any migration claim by asking which method produced the number.
- gre
- mcat
- asvab
- sat
- act
- digital-adaptive
- official-material
- section-strategy
- test-date-timeline
When someone reports a monarch number, ask which method produced it. Was the unit an individually tagged butterfly, a volunteer sighting, an occupied hectare, or an orientation angle measured in an experiment? Those observations answer different questions. Treating them all as interchangeable “tracking data” is how a useful figure turns into an unsupported claim.
For students, the essential task is to reconstruct the evidence chain: what was directly observed, what was calculated afterward, and which butterflies had a realistic chance of entering the dataset. This is supporting science-reading material rather than a primary exam resource, but the same distinctions matter whenever a passage asks whether evidence actually supports a conclusion.
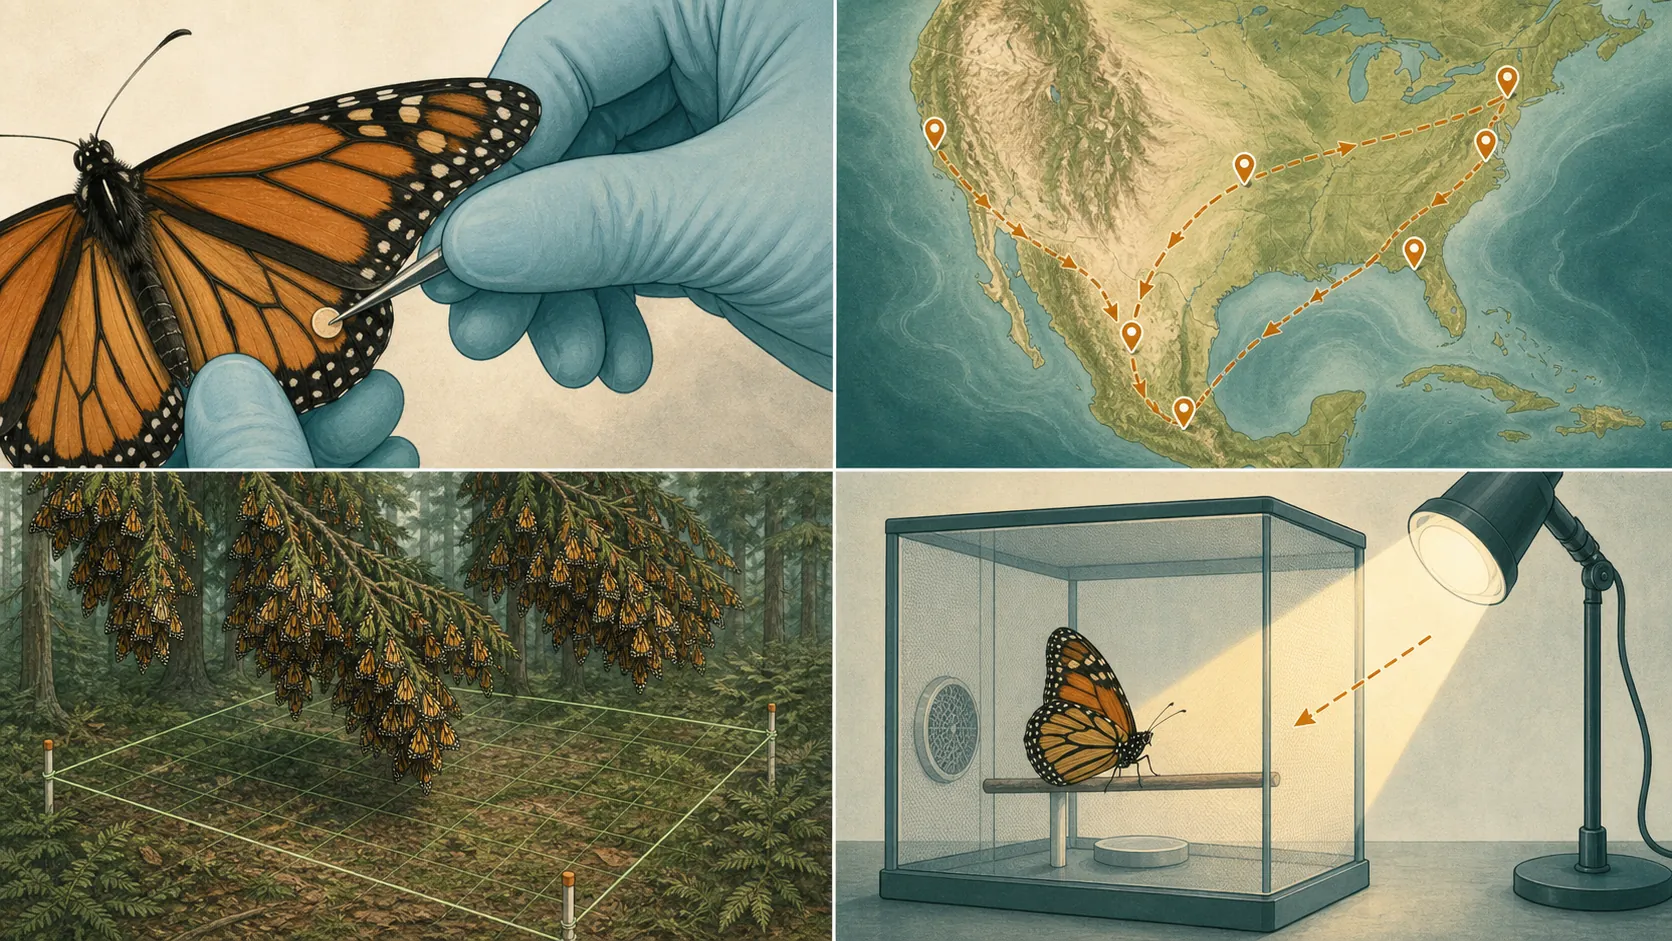
Four methods, four kinds of evidence
| Method | Measured unit | Question it can answer | Chief limitation |
|---|---|---|---|
| Physical tagging and recovery | Tagged individuals and recovery locations | Where a recovered individual ended up; clues about route, timing, and flight performance [1] | Few tags are recovered, and recovery opportunity is uneven; the sample cannot serve as a population count |
| Volunteer sighting network | Sightings, first observations, and reported roosts | When migration appears in an area, how its front advances, and where roost activity is reported [2] | Observer coverage and reporting effort vary; a sighting is not a census |
| Overwintering census | Hectares occupied by clustered monarchs | How much winter habitat is occupied; abundance can then be estimated with an assumed density [3][4] | The directly measured area must be converted into butterflies, adding uncertainty |
| Controlled navigation experiment | Orientation direction or angle under altered conditions | Whether a manipulated cue changes the butterflies’ chosen direction [5] | A controlled result identifies a possible mechanism, not the size or route of a wild population |
What a physical tag follows—and what it misses
Monarch Watch began its tagging program in 1992 and distributes more than 250,000 tags each fall for use east of the Rocky Mountains. A small adhesive tag is placed on the discal cell of the butterfly’s hindwing. Each tag carries identifying information that can connect the original tagging record with a later recovery.[1]
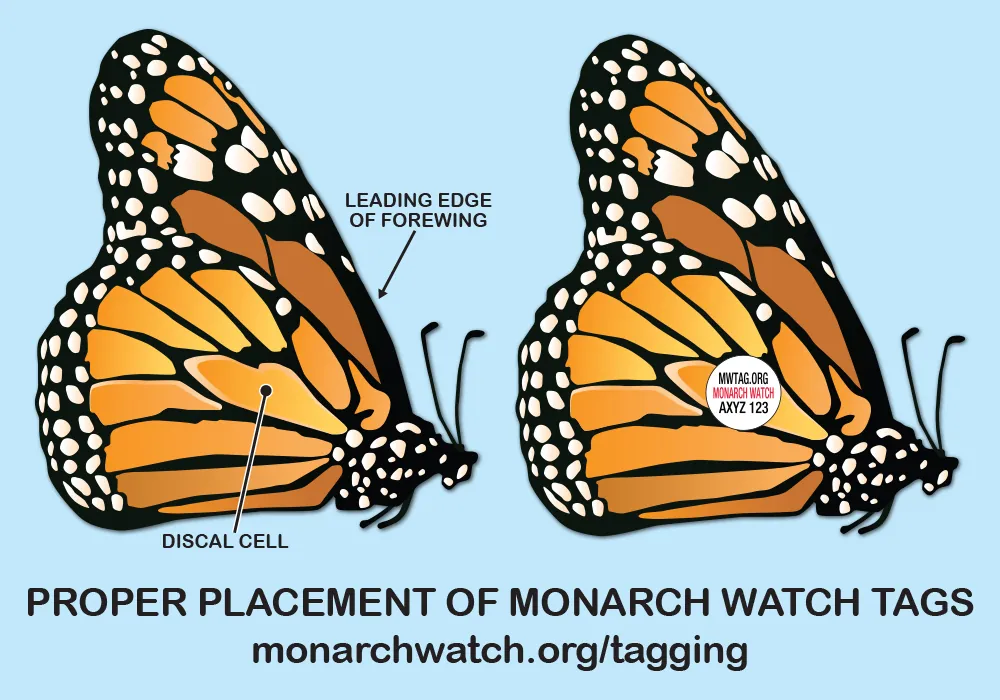
The procedure creates a chain of custody. A participant tags the butterfly and records the tagging information. If that tag is later recovered in Mexico, approximately $5 is paid for it. Monarch Watch verifies the recoveries and posts the results in the spring.[1] The polished endpoint—a line in a recovery dataset—therefore rests on capture, correct placement, recordkeeping, physical recovery, reporting, and verification.
A verified recovery establishes a connection between an individual’s tagging record and its recovery endpoint. If the dates are known, researchers may also calculate elapsed time or a minimum average pace between those points. They do not obtain a continuous GPS-like track. The butterfly’s exact path, stops, and daily movements between tagging and recovery remain unobserved.
That distinction matters because recovery is rare and selective. A tag can enter the final dataset only if the butterfly is tagged, reaches a place where recovery is possible, is found, and is reported through the program. Conditions affecting any of those steps can skew the recovered sample. A map of recoveries can reveal endpoints and route clues, but empty space on the map does not prove that monarchs avoided it.
Nor can the number of recovered tags be treated as a population estimate. Ten recoveries do not represent a known fraction of all migrating monarchs unless the probability of recovery is known and adequately modeled. Here it is both low and uneven. Tagging is strong individual-level evidence with a weak basis for simply scaling up to “how many monarchs were there?”
Volunteer observations reveal timing, not a complete head count
Journey North collects volunteer observations across broad geographic areas. Its monarch records include spring first sightings and fall roost reports, with reported roosts ranging from 10 to more than 1,000 monarchs.[2] When observations are mapped by date, they can show phenology—the seasonal timing of biological events—and the apparent pace of movement across regions.
The network’s scientific value comes from reach and repetition. Many observers can document when monarchs first appear, where clusters form, and how reports shift over a season. That evidence can reveal a migration front that no single field team could watch everywhere at once.
The reported unit remains an observation. A roost report of 500 monarchs means an observer reported approximately that many at a particular place and time; it does not mean the surrounding region contained exactly 500. Areas with more participants, easier access, better visibility, or greater public interest can produce more reports even if underlying abundance is similar elsewhere. Repeated sightings may also involve butterflies that cannot be individually distinguished.
Consequently, a sighting map can support a claim about reported timing or geographic progression. It cannot, without additional sampling design and analysis, support a claim that every blank area had no monarchs or that the number of map pins equals the number of butterflies.
A winter census measures hectares before it estimates butterflies
At overwintering sites in Mexico, monarchs cluster so densely that counting individuals directly is impractical. The census therefore measures the area occupied by the colonies. For the 2025–26 season, the CONANP/WWF survey reported 2.93 hectares occupied.[4] The noun after the number is essential: the direct result was hectares, not 2.93 million butterflies and not a direct count of every insect.
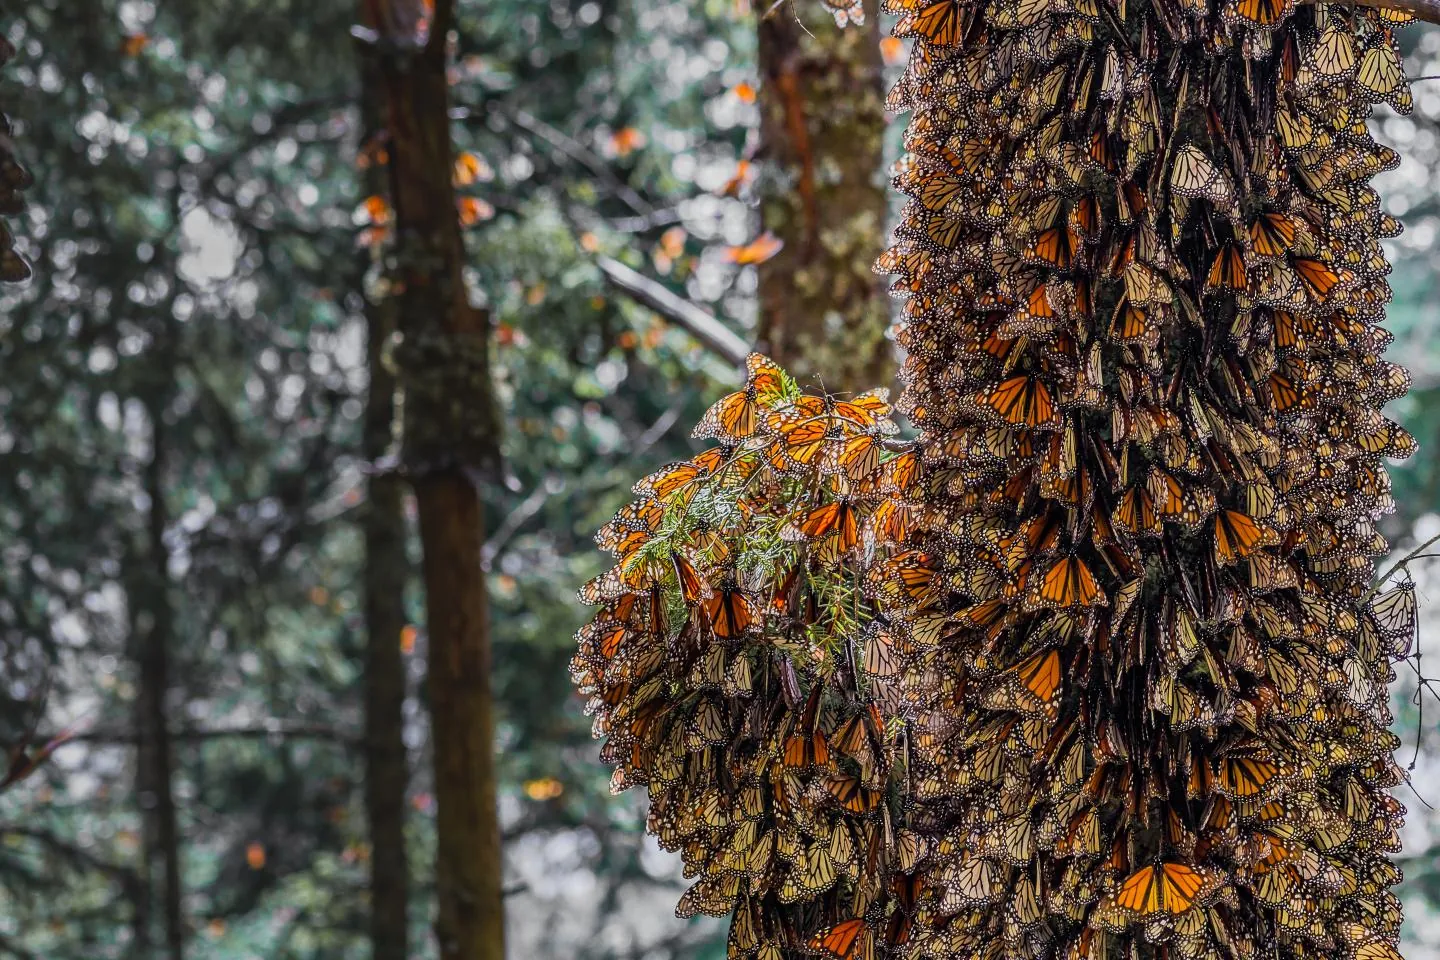
Turning that area into an estimated number of monarchs requires a density assumption. Monarch Joint Venture summarizes estimates of approximately 20–30 million monarchs per hectare, including a median estimate of 21.1 million per hectare reported by Thogmartin and colleagues in 2017.[3] These figures are conversion factors, not additional hectares measured during the 2025–26 survey.
The arithmetic makes the boundary between observation and inference visible. Applying the broad density range to 2.93 hectares gives an illustrative estimate of 58.6–87.9 million monarchs. Applying the 21.1-million median gives about 61.8 million. Those products are calculated estimates based on two inputs: measured occupied area and assumed butterflies per hectare. They should not be rewritten as “scientists counted 61.8 million monarchs.”
| Stage | Value | Evidence label |
|---|---|---|
| Field survey | 2.93 hectares occupied in 2025–26 | Area measurement [4] |
| Density factor | Approximately 20–30 million monarchs per hectare; median 21.1 million | Estimated conversion factor [3] |
| Illustrative multiplication | 2.93 × 21.1 million ≈ 61.8 million monarchs | Derived estimate, not an individual count |
Uncertainty can enter on both sides of the multiplication. Surveyors must determine colony boundaries and occupied area, while density varies with clustering conditions and cannot be known exactly for every hectare. The resulting population-scale estimate is still useful, provided its method and uncertainty are not hidden behind a single clean-looking number.
Changing the clock tests a navigation mechanism
A navigation experiment asks a different question from a tag recovery or winter census. In a 1997 experiment by Perez, Taylor, and Janders, researchers shifted monarchs’ internal clocks and compared their orientation with that of controls. The clock-shifted butterflies oriented nearly 90 degrees differently.[5]
This is persuasive mechanistic evidence because the researchers altered a variable and observed a directional response. The result supports a time-compensated sun compass: the butterflies’ interpretation of the sun’s position depends on their internal time. The experiment does not show how many monarchs migrate, and it does not reconstruct the entire route of any wild butterfly.
Claims about magnetic-field orientation require more restraint. The supplied evidence describes magnetic orientation as unproven.[5] That does not establish that magnetic cues play no role; it means the available material does not justify presenting the mechanism as settled. “Supported by a controlled clock-shift result” and “suggested but unproven” are different evidence labels.
How to audit a monarch migration claim
A credible-looking number can still be misread if its source, unit, or collection procedure disappears. Use the following sequence before placing a migration figure in a report:
- Identify the source. Find the institution, research paper, monitoring program, or species profile that originally supplied the claim.
- Name the method. Determine whether the figure came from tags, volunteer reports, an area survey, an experiment, or another defined procedure.
- Write down the unit. Look for butterflies, tag recoveries, sightings, roosts, hectares, miles, days, or degrees of orientation.
- Separate direct observation from calculation. For example, occupied hectares may be measured directly while butterfly abundance is estimated through a density conversion.
- Check the sampling limit. Ask which butterflies, locations, and times could enter the dataset—and which were likely to be missed.
- Check the date. Seasonal results, conservation status, and agency summaries can change, so record the relevant survey season or page update.
- Match the conclusion to the method. Do not turn an individual recovery into a population claim, a sighting map into a census, or an experimental orientation change into proof of a complete migration route.
Consider several figures in the U.S. Fish and Wildlife Service species profile. It states that eastern monarchs can fly more than 2,000 miles, travel roughly 70–75 miles per day, and that the longest single-day flight recorded for a tagged eastern monarch was 265 miles.[6] These figures do not have identical evidentiary meaning merely because they all use miles.
The 265-mile statement identifies a tagged individual and a single-day maximum. It should not become “monarchs normally fly 265 miles per day.” The 70–75-mile figure is presented as a rough daily pace, while “more than 2,000 miles” describes the possible scale of an eastern migration.[6] If another source gives a differently worded distance range, retain each source’s wording and attribution instead of blending the figures into false agreement.
Time-sensitive status note
Last reviewed: August 27, 2026. The U.S. Fish and Wildlife Service proposed listing the monarch butterfly as threatened on December 12, 2024. No final ruling was reported on the agency page updated July 23, 2026.[6] A paper written now should describe the listing as proposed, not final, and should attach a date to that statement.
There is no single “monarch number.” There are tagged individuals, reported sightings, occupied hectares, converted abundance estimates, travel measurements, and experimental orientation angles. Each becomes trustworthy for a particular claim only when its method, unit, and limits remain attached.
For practice applying the same reasoning, compare claims with observations in the orcas-versus-great-whites evidence guide, examine how conclusions are built from Curiosity’s Mars polygon features, review claim-evidence-warrant structure, or work through the science visualization guide using Google Earth.
References
- Monarch Watch Tagging Program — Monarch Watch
- Monarchs — Journey North
- Monarch Joint Venture — Monarch Joint Venture
- Where Do Monarchs Go in the Winter? — Journey North
- Monarch Navigation — Journey North
- Monarch Butterfly (Danaus plexippus) — U.S. Fish & Wildlife Service, updated July 23, 2026
Related exhibits & inventory
Verified outcomes
No verified outcomes on file for this exam yet
See Methodology for how outcome evidence is disclosed once logged.
Planners
No planner filed for this exam yet
A downloadable timeline template for this exam hasn't been published yet.
Tool verdicts
AI-tool cautions
No AI tools tested for this exam yet
No hands-on AI-accuracy logs have been filed for this exam.
Questions about this plan
Ask a question about a specific section, timeline, or citation in this plan — or flag something that needs correcting.
Comments
Join the discussion with an anonymous comment.