
MCAT Exam Hub
How to Use Google Earth for Science Discovery on the MCAT and SAT
Visualizing ecological and geological change with free Google Earth tools helps you understand the concepts tested on MCAT, SAT, ACT, and ASVAB science sections. This guide shows how to use Timelapse, Voyager, and 3D terrain as active study drills instead of passive video watching.
- SAT
- ACT
- GRE
- MCAT
- ASVAB
- digital-sat
- adaptive-testing
- registration-fee
- content-outline
- score-target
A science passage can feel unfair when you know the vocabulary but cannot picture the system. A student may be able to define succession, biome, erosion, carrying capacity, or watershed, then still lose time when the passage asks what should happen after a forest edge expands, a glacier retreats, or a river cuts through a valley. The missing piece is often not another definition. It is a working image of change across space and time.
That is the useful answer to the search question, “how to use Google Maps for science discovery,” at least for exam prep: use Google Earth, especially Timelapse, Voyager, and 3D terrain, as short active drills. The goal is not to wander around satellite imagery until studying feels more interesting. The goal is to practice the same moves that science passages reward: observe a pattern, name a variable, compare regions, make a claim from evidence, and check whether the concept belongs on your exam.
For the MCAT, that check matters. The AAMC’s Biological and Biochemical Foundations section includes content category 2B, which covers ecology, population biology, and diversity, but that does not mean every beautiful Earth view is MCAT-relevant or that Google Earth is a substitute for AAMC practice passages.[1] For SAT, ACT, and ASVAB science preparation, the same caution applies: visual drills can strengthen your mental model, but official materials still decide the test format, timing, and question style.
Use Google Earth Like a Passage, Not a Video
The first rule is simple: do not watch passively. If you spend fifteen minutes in Google Earth and leave with only “that was cool,” the session did not become exam prep. A useful session produces something you can retrieve later: a before-and-after observation, a concept label, a comparison, or a question that resembles a science passage prompt.
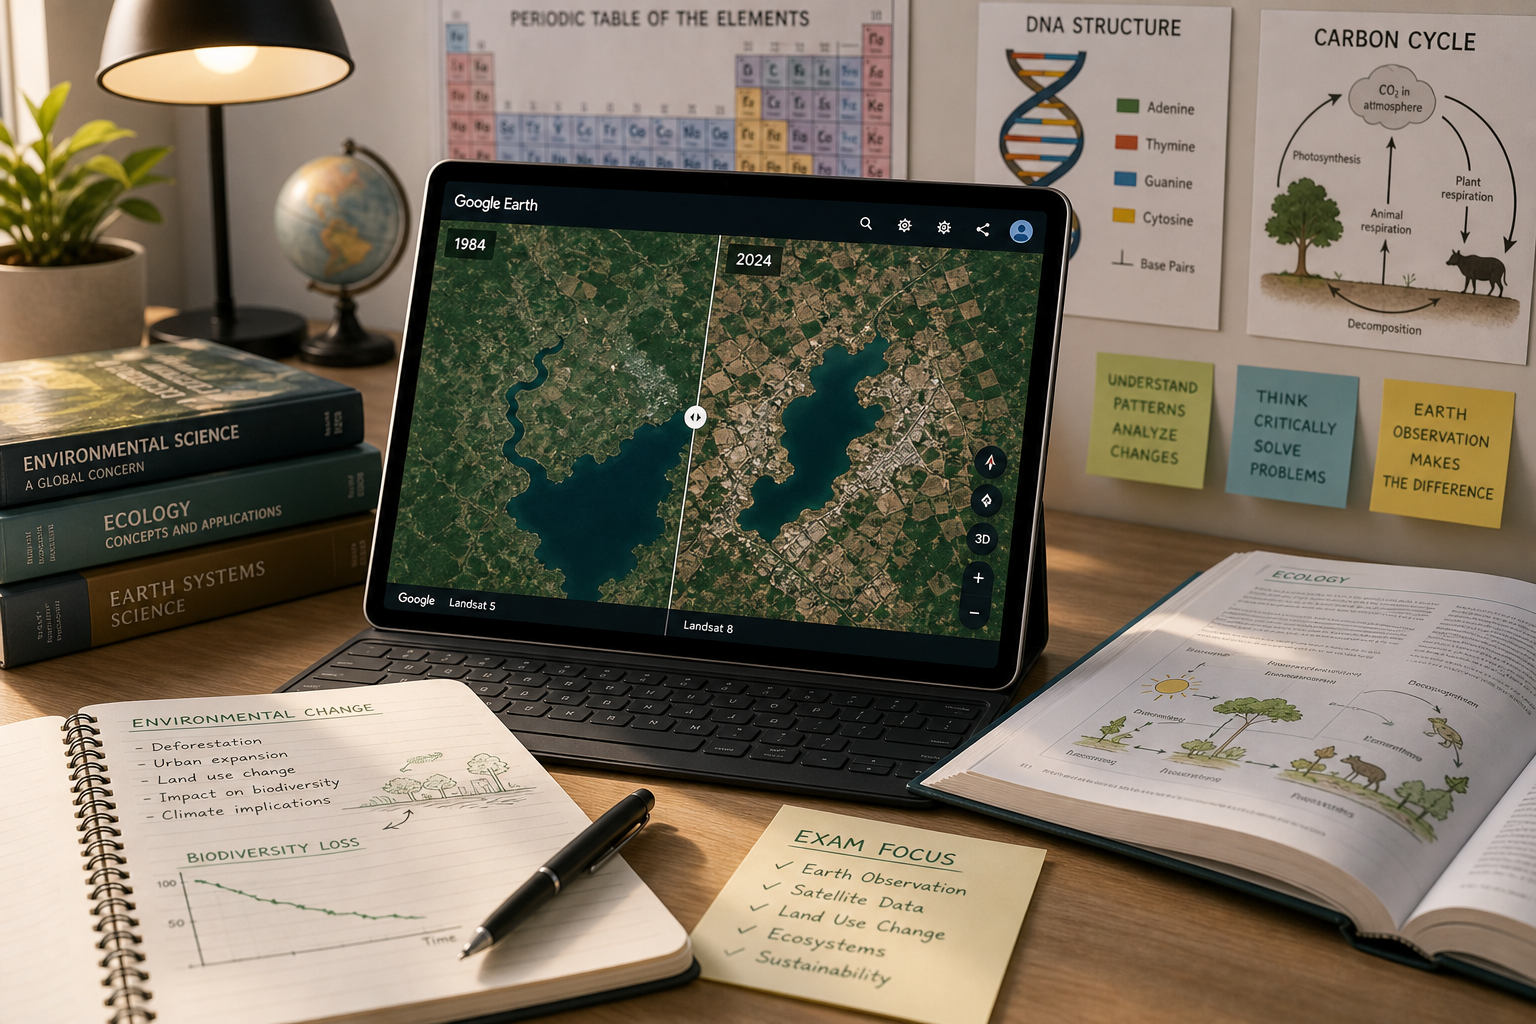
Google Earth’s value is that it turns static textbook language into visible evidence. Timelapse lets you observe landscape change from 1984 through 2022 using a global archive built from more than 80 petabytes of satellite imagery from NASA, USGS, ESA, and the European Commission.[2] That range is long enough for students to see many environmental changes as trends rather than isolated snapshots.
There is also a reason to trust the tool as more than a novelty. SERC at Carleton College lists more than 60 teaching activities that use Google Earth in geoscience instruction.[3] That does not prove a score increase on the MCAT, SAT, ACT, or ASVAB. It does show that instructors already use the platform to teach serious spatial and Earth-system reasoning, which is the part test-takers can borrow.
| Google Earth feature | Best exam-prep use | What to produce |
|---|---|---|
| Timelapse | Ecology, climate, land-use change, glaciers, deforestation, urbanization | A before/after claim supported by visible evidence |
| Voyager | Guided ecosystems, biodiversity, climate, ocean and Earth science topics | A concept map or short passage-style summary |
| 3D terrain | Landforms, watersheds, erosion, geological reasoning | A labeled sketch or explanation of how shape affects flow, exposure, or erosion |
Start With Timelapse Because Change Is the Test
Timelapse is the strongest first tool because it gives you an immediate dataset. You do not need to code in Google Earth Engine, and you do not need a long tutorial before the science begins. Open the Timelapse viewer, choose a location, and watch what changes. Then slow down and turn the visual impression into a claim.
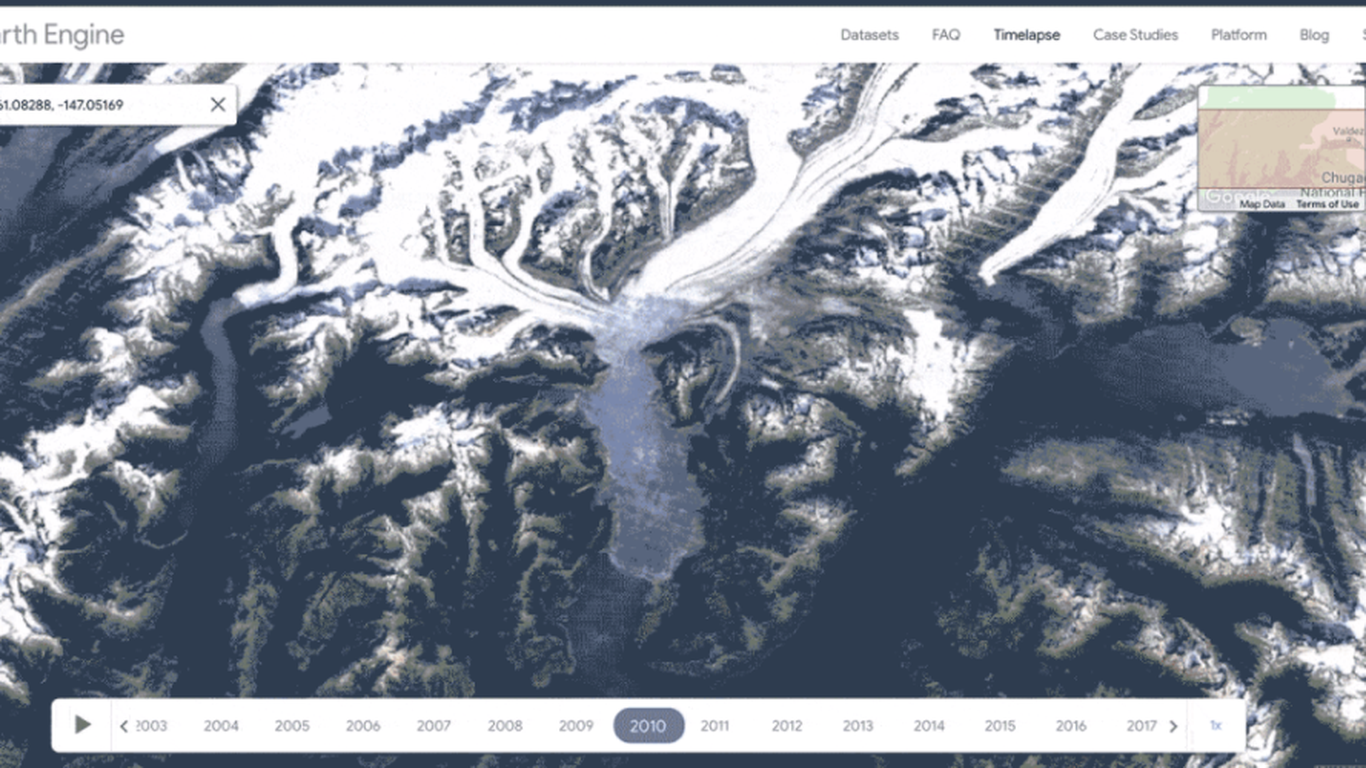
A good Timelapse drill has five parts. First, choose a place where a visible change is likely: a glacier margin, a forest frontier, a growing city, a shrinking lake, or a desert edge. Second, describe the first frame without interpreting it yet. Third, describe the later frame the same way. Fourth, name the variable that appears to change: vegetation cover, ice extent, exposed soil, water area, road density, urban area, or coastline position. Fifth, connect the observation to one exam concept.
- Observation: “The lighter exposed area expands while the darker vegetated area becomes more fragmented.”
- Possible variable: “Vegetation cover or land-use pattern.”
- Concept connection: “Habitat fragmentation, edge effects, biodiversity, or population distribution.”
- Passage-style move: “If the same trend continues, which population would likely be most affected: a generalist species, a specialist species requiring continuous habitat, or an introduced species using roads as corridors?”
Notice the restraint in that example. The image may suggest deforestation, development, drought, policy change, agriculture, fire, or some combination of causes. Unless the source gives you the cause, do not pretend the image alone proves it. On exams, that discipline matters. Many wrong answers come from students who leap from a pattern to a cause the passage did not support.
Drill 1: Glacier Retreat
Search for a glacier region in Timelapse and watch the boundary between ice, rock, water, and vegetation. Your task is not to memorize the place name. Your task is to practice describing a moving boundary. Does the ice edge pull back? Does exposed land increase? Do new water features appear where ice was previously visible?
Then convert the image into exam language. A biology passage might ask about habitat availability, primary succession, species colonization, or ecological niches after ice retreat. An Earth science passage might ask about albedo, water flow, sediment exposure, or climate indicators. The same visual can support different questions, so the safest study product is a claim with a named variable: “Across the time window, visible ice area decreases while exposed land or water increases.”
Drill 2: Forest Loss and Fragmentation
For ecology practice, forest change is especially productive because it forces you to separate total area from spatial pattern. A passage may not simply ask whether forest cover decreased. It may ask what happens when one large habitat becomes several smaller patches, when edge habitat increases, or when movement between populations becomes harder.
Use Timelapse to compare a continuous-looking forest region with a later fragmented pattern. Write two observations, not one: one about amount and one about arrangement. “Vegetation cover appears reduced” is different from “remaining vegetation appears divided into smaller patches.” The second sentence is often the one that helps with biodiversity, gene flow, migration, and population isolation questions.
Drill 3: Urbanization and Heat-Island Reasoning
Urban growth is useful because the visual variables are easy to see: roads, dense built surfaces, reduced vegetation, and changed boundaries between city and surrounding land. Timelapse can show expanding urban footprints over the 1984–2022 record, but the image itself does not directly measure temperature unless the dataset or passage provides that information.[2] That distinction is exactly what exam questions test.
A safe passage-style prompt would be: “Based on the visible change in land cover, which additional measurement would best test whether an urban heat island effect increased?” The answer should require temperature data, surface material data, or vegetation coverage data, not a guess based only on how gray the image looks.
Let Voyager Teach You What to Look For
Timelapse is excellent once you know how to observe. Voyager is useful when you do not yet know what deserves attention. Google Earth Education points students and teachers to resources and guided explorations, including Voyager materials connected with organizations such as National Geographic, NASA, and the BBC.[4] These tours can act like training wheels for passage reading: they tell you where to look, then you practice extracting the science yourself.
Use Voyager differently from entertainment browsing. Pick one tour related to ecosystems, oceans, climate, biodiversity, or geological history. Before opening it, write the concept you are trying to strengthen. For an MCAT student, that might be population distribution, ecosystem interactions, or diversity. For an SAT or ACT student, it might be interpreting mapped data, comparing environments, or connecting a graph-like trend to a written explanation.
- Before the tour: name the exam concept you are practicing.
- During the tour: pause after each major location and write one observation that could be evidence in a passage.
- After the tour: write a three-sentence mini-passage using only what you observed.
- Final check: ask whether the concept appears in your official exam outline or practice materials.
For example, a biodiversity tour should not end with “biodiversity is important.” That sentence is too broad to help under timed conditions. A better product is: “Region A contains more varied habitat zones than Region B. If habitat variety supports more niches, the passage might predict greater species diversity in Region A, assuming other limiting factors are not stronger.” That last clause is not decoration; it keeps the claim from becoming too certain.
Voyager is also a good place to practice separating adoption from evidence. A guided tour made with a respected partner can be educationally useful, but it is not automatically an exam-validated curriculum. Treat it as a source of context and examples, then return to official AAMC, College Board, ACT, or ASVAB-aligned practice for question style.
Use 3D Terrain for Shape, Flow, and Erosion
Some students can identify a river on a flat map but cannot explain why water moves the way it does through a landscape. This is where 3D terrain earns its time. Use it for landforms, slopes, watersheds, erosion patterns, mountain shadows, valleys, and coastlines. Do not turn it into a full geography tour; keep the drill tied to a question you might actually see.
Choose a mountainous or river-rich area and tilt the view. Trace where water would likely flow from higher ground to lower ground. Identify ridges that separate drainage areas. Look for places where steep slopes might increase erosion risk compared with flatter areas. Then sketch a rough version on paper and label only the features that matter: high ground, low ground, flow direction, channel, ridge, valley, and deposition area.
This drill helps with Earth science passages because many questions hide the mechanism inside the shape. If a passage describes increased rainfall, slope instability, sediment transport, or downstream turbidity, your mental image should already include gravity, flow paths, exposed soil, and collection points. The terrain view gives you a way to rehearse that image before the exam clock is running.
A 15-Minute Weekly Routine
The routine should be short enough that it does not steal time from official practice. Once a week is enough for most students unless ecology or Earth science is a major weakness. Set a timer for fifteen minutes and stop when the product is finished, not when the map stops being interesting.
| Minute | Action | Study product |
|---|---|---|
| 0–2 | Choose one exam concept and one Google Earth feature | A clear target, such as habitat fragmentation, glacier retreat, watershed flow, or biome comparison |
| 2–7 | Observe without explaining too soon | Two concrete observations about location, direction, amount, boundary, or pattern |
| 7–10 | Name the variable and concept | One sentence connecting the visual evidence to ecology, geology, climate, or Earth systems |
| 10–13 | Write a passage-style question | One question that asks for prediction, comparison, evidence, or an additional measurement |
| 13–15 | Cross-check against official materials | A note on whether this concept belongs in your exam outline or practice set |
A finished entry might look like this: “Timelapse showed a visible retreat of an ice boundary and an increase in exposed land or water. Concept: climate-related landscape change and primary succession. Passage question: which organism type would most likely colonize newly exposed rock first, and what additional evidence would support that prediction?” That is better than ten minutes of watching because it leaves you with something testable.
For MCAT students, pair the routine with the AAMC outline and practice passages so you do not over-study visually interesting topics that rarely appear in your materials.[1] For SAT, ACT, and ASVAB students, pair it with official or exam-aligned science passages so the visual skill transfers into timed reading, graph interpretation, and answer elimination. Google Earth can help you see the system. It does not replace the exam.
What Not to Do
Do not turn this into Google Earth Engine coding unless coding is separately part of your study goal. The Timelapse viewer, Voyager, and the basic Google Earth app are the relevant tools here; API access to Google Earth Engine is a different workflow and may require a Google account. For most exam-prep students, the return on time comes from observation and reasoning, not from building a remote-sensing project.
Do not claim more certainty than the image supports. A satellite view can show that a boundary moved, a color pattern changed, or a built-up area expanded. It may not tell you the cause, the policy history, the population effect, or the measured temperature unless another source provides that information. This is not a weakness of the drill. It is exactly the habit that helps on evidence-based questions.
And do not confuse visual confidence with completed preparation. A student who finally sees succession or erosion may feel a real click; that click matters. But the exam still asks in its own format, under time pressure, with distractors. Use Google Earth to build the picture, then use official practice to test whether you can apply it.
A Brief Note on Where the Tools Are Going
Earth observation tools are becoming more powerful. A 2025 Nature news article reported on Google AI models that map Earth at unprecedented resolution using trillions of images.[5] That is worth knowing, but it should not change the study method. For an exam deadline, the useful question is still smaller: can you look at evidence, describe the pattern accurately, and connect it to the concept your test actually assesses?
References
- Biological and Biochemical Foundations of Living Systems Overview, AAMC.
- Timelapse, Google Earth Engine.
- Google Earth Activities, SERC Carleton.
- Google Earth Education Resources, Google Earth Education.
- Google AI models now map Earth at unprecedented resolution using trillions of images, Nature, 2025.
Related exhibits & inventory
Verified outcomes
Planners
No planner filed for this exam yet
A downloadable timeline template for this exam hasn't been published yet.
Tool verdicts
Questions about this plan
Ask a question about a specific section, timeline, or citation in this plan — or flag something that needs correcting.
Comments
Join the discussion with an anonymous comment.