

How World Cup Viewership Statistics Are Actually Measured
World Cup viewership numbers are not simple facts—they are constructed through contested methodologies. This article explains how Nielsen panels, streaming data, out-of-home measurement, and FIFA's population-upweighting formulas produce the headlines, and why understanding these methods matters for evaluating audience statistics critically.
Updated:
A World Cup audience number usually arrives dressed as a fact: so many millions watched a match, so many billions were reached by the tournament, records were broken, attention was global. In Q3 2026, that is especially tempting. The final has just happened, FIFA has already promoted the tournament’s global audience performance, and news coverage has been tracking the ratings story while the event is still fresh.[1][2][3]
But any study of World Cup viewership statistics should start one step earlier than the headline. It should ask what the number counted. A person watching alone on a living-room television, a fan watching a stream on a phone, a group in a bar, and an inferred audience in a country without a local measurement panel may all end up inside “viewership.” They did not get there through the same door.
That distinction matters right now because consolidated post-tournament data for the 2026 World Cup is not yet available. As of July 20, 2026, the public conversation is still working with press releases, reporting, overnight or preliminary figures, and measurement systems whose definitions changed before and during the tournament. The safer question is not “How many people watched?” It is “Which people, on which platform, in which setting, counted by whom, using which formula?”
The Unit Being Counted Is Not Always a Person
Audience measurement sounds simple because ordinary language makes it simple. “Watched” feels like a yes-or-no verb. Measurement systems need more machinery than that. They have to decide whether they are counting viewers, households, devices, average minute audiences, cumulative reach, streams, or people who crossed a minimum exposure threshold.
Those units are not interchangeable. A cumulative reach figure can be much larger than an average audience because it may include anyone who watched at least some qualifying amount of coverage. A device count is not the same as a person count because one stream can serve several people, and one person can use several devices. A household television rating does not automatically include a watch party in a bar unless the measurement system has a way to include out-of-home viewing.
This is why the largest World Cup numbers need the most careful reading. FIFA’s 2022 global audience materials included a claim that 1.5 billion people were reached by the final, but “reached” is a methodological term, not a synonym for “sat through the whole match.”[4] It belongs to a specific reporting framework. Used carefully, it can describe scale. Used loosely, it becomes a very large blur.
In-Home Television: The Familiar Part of the System
The most familiar U.S. television ratings come from panels. Nielsen’s role is to observe the viewing behavior of selected households and use those observations to estimate a larger population. For the 2026 World Cup, Nielsen has presented a fan scorecard and measurement framework that places television viewing within a broader sports-audience measurement system.[5]
A panel is not a census. That is not an insult; it is the point of the design. A properly built panel lets researchers estimate behavior without watching every household. The tradeoff is that the estimate depends on sampling, weighting, panel maintenance, device coverage, and the definition of the viewing event. When a student writes a ratings number into a report as if it were a turnstile count, the first mistake has already happened.
For a World Cup match on television, the in-home panel can answer a narrow question reasonably well: among measured households, how much viewing occurred on the covered television sources, and how should that be projected to the relevant market? It cannot, by itself, answer every question that the public wants answered. It does not automatically count a crowd gathered around one screen at a pub. It does not automatically reconcile a broadcaster’s streaming logs with panel estimates. It does not solve the problem of countries where the equivalent panel data do not exist or are not used in the same way.
Out-of-Home Viewing Changed the Comparison
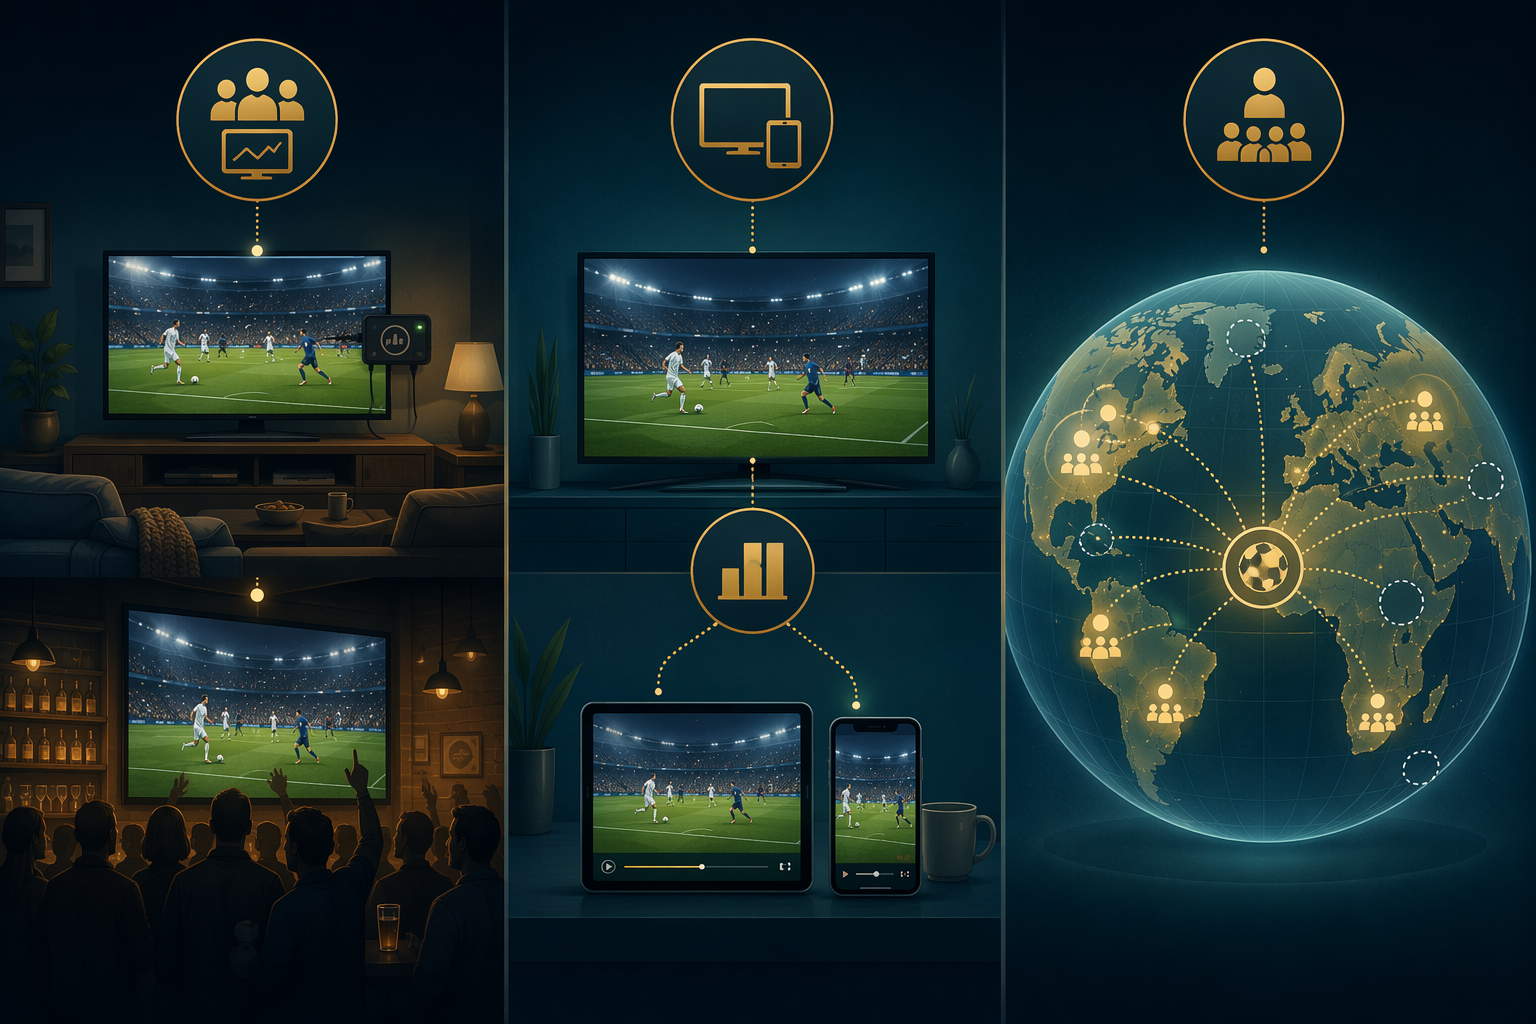
World Cup viewing is almost designed to expose the limits of living-room measurement. Fans watch in bars, offices, campuses, restaurants, public squares, and organized watch parties. If those settings are missing, the audience total is not just smaller; it is smaller in a patterned way. Sports with communal viewing lose more than programs people mostly watch at home.
That is why Nielsen’s out-of-home expansion matters so much for interpreting 2026 figures. Front Office Sports reported that Nielsen’s early-2025 expansion of out-of-home measurement added roughly 25% to reported World Cup audiences, with the lift coming from places such as bars and watch parties.[6] A change of that size is not a rounding issue. It can make a match look substantially more popular even when the underlying fan behavior has not changed by the same amount.
| Viewing setting | What changes methodologically |
|---|---|
| Living-room television | Panel measurement can estimate covered in-home viewing. |
| Bar or restaurant | The system needs out-of-home measurement rather than assuming one screen equals one household. |
| Watch party or fan zone | The number of viewers around a shared screen becomes the problem, not just whether the screen was on. |
| Phone or connected device stream | Streaming logs and identity rules enter the estimate. |
| Market without a local measurement panel | Global reporting may rely on modeled estimation or population-upweighting. |
The practical consequence is simple and easy to miss: a 2026 U.S. audience figure that includes expanded out-of-home measurement should not be dropped into a spreadsheet beside a pre-2025 figure as if both were measured under the same rules. The comparison may still be useful, but only if the method change is stated next to the number. Otherwise the spreadsheet is partly comparing audience behavior and partly comparing measurement coverage.
This is also the kind of change that can travel poorly through headlines. “Audience is up” is a cleaner sentence than “audience is up under a measurement system that now includes more out-of-home viewing than before.” The second sentence is less elegant and more honest.
Streaming Adds a Different Counting Problem
Streaming looks more countable than television because platforms generate logs. A server can know that a stream started, paused, buffered, resumed, or ended. That does not mean the audience question is solved. A stream is not necessarily a viewer. A viewer is not necessarily unique across devices. A session can be short, duplicated, co-viewed, or authenticated through a household account used by several people.
Hybrid metrics try to combine television and digital viewing into a single public number. NBCUniversal and Telemundo’s Total Audience Delivery approach for the 2026 World Cup is the main case to study because it shows how attractive and unstable a combined metric can be. The metric brought together television viewing and streaming measurement, including Peacock, but early 2026 figures were later revised downward by 36%, prompting skepticism from industry insiders about the original count and the use of first-party streaming data alongside third-party measurement.[7]
A downward revision of that size does useful damage to overconfidence. It does not prove that hybrid audience metrics are useless. It proves that the public number depends on implementation details most readers never see: how streams are validated, how duplicate viewing is handled, how long a stream must last to qualify, how first-party platform data are reconciled with independent measurement, and when an error becomes large enough to correct publicly.
The revised Telemundo numbers may be more reliable for later matches, but the episode leaves a consistency problem across the full tournament. If early figures were generated under a flawed or later-corrected process, then a tournament-wide trend line may contain a methodological bend. A viewer may experience the tournament as one continuous event. The data may not.
Why First-Party and Third-Party Data Do Different Jobs
First-party data are not automatically bad. A streaming platform has direct access to technical events that an outside panel may not see in the same detail. It can observe sessions at scale, detect device behavior, and report quickly. For operations, that is valuable.
The concern is incentives and comparability. A platform has a business interest in making usage legible and impressive. A third-party measurement company has its own limitations, but it is at least positioned to provide a common yardstick across sellers. When a Total Audience Delivery number blends first-party and third-party inputs, the reader has to ask whether the final figure is a neutral estimate, a sales metric, or a negotiated bridge between systems.
For student projects, this is a good place to slow down. Do not write “streaming increased the audience” unless the source actually measures audience. Sometimes the source measures starts, minutes, average minute audience, devices, or total delivery under a proprietary formula. Those may be evidence of audience behavior, but they are not identical observations.
FIFA’s Global Numbers Add a Modeling Layer
National ratings and global reach claims are not the same kind of object. National ratings can often be traced to a local measurement system. Global claims have to pass through many markets, platforms, rights holders, and data gaps. FIFA’s own methodology for the Qatar 2022 global engagement and audience report describes how it handles markets with available audience data and markets without formal measurement panels, including the use of population-upweighting formulas where local measurement is missing.[4]
Population-upweighting is not a magic trick. It is an estimation strategy. If a comparable market has measured viewing, analysts may use that information, along with population data and other assumptions, to estimate viewing in a market where direct panel measurement is absent. This can be a reasonable way to avoid pretending that unmeasured countries do not exist. It also means the final global number contains modeled components whose error is hard for outsiders to evaluate.
The key weakness is not that FIFA estimates. Large international audience reports usually have to estimate somewhere. The weakness is that the margin of error around the largest global claims is not visible in the way the headline travels. “Billions reached” reads like a count. In markets without direct measurement, part of it is an inference.
That matters for 2026 because FIFA has already issued audience-facing claims about the tournament while the final consolidated global report is still unavailable.[1][2] Press releases can be accurate within their own scope and still be premature as a basis for careful comparison. A preliminary tournament claim and a later global audience report are different research products.
The Same Match Can Produce Several True-Looking Numbers
Imagine one World Cup match. A household panel estimates in-home television viewing. An expanded measurement system adds people watching in bars and watch parties. A broadcaster reports a combined television-and-streaming delivery figure. FIFA later incorporates national reports and modeled estimates into a global reach number. None of these numbers has to be fraudulent for them to disagree.
They disagree because they answer different questions:
- How many people watched on measured in-home television?
- How many watched when out-of-home locations are included?
- How much combined delivery came from television and streaming under a broadcaster’s formula?
- How many people were reached globally once measured and modeled markets are combined?
Those questions are close enough to be confused and different enough to cause trouble. A bar crowd is not a Peacock stream. A Peacock stream is not a household panel observation. A household panel observation in one market is not a population-upweighted estimate in an unmeasured market.
Historical Comparisons Need Extra Restraint
World Cup history invites ranking. Biggest final, biggest tournament, biggest global moment. Some comparisons are reasonable when the methods are close and the caveats are visible. Older comparisons are weaker. Historical finals before 2002 were measured inconsistently, and older global figures, including disputed claims around the 1998 final, should be treated cautiously rather than polished into a clean time series.
Even recent comparisons can mislead if they cross a measurement break. A 2026 audience figure that benefits from expanded out-of-home inclusion is not directly equivalent to a pre-2025 U.S. figure that did not include out-of-home viewing in the same way.[6] A 2026 broadcaster total affected by a later Total Audience Delivery revision should not be compared casually with an unrevised early number.[7] A FIFA global reach estimate should not be compared with a national average audience as if both share a denominator.[4]
How to Read a World Cup Audience Claim
A useful reading method is short enough to fit in the margin of an article or the notes column of a spreadsheet. Before using a World Cup audience statistic, identify five things:
- The unit: viewers, households, devices, streams, average audience, total delivery, or reach.
- The setting: in-home only, out-of-home included, streaming included, or global across markets.
- The source: third-party panel, broadcaster first-party data, FIFA report, press release, or journalism summarizing those sources.
- The status: overnight, preliminary, revised, or consolidated after the tournament.
- The comparison rule: whether the other number was produced under the same method.
This does not make the number less interesting. It makes it usable. A headline can tell you that attention was large. A method tells you what kind of largeness is being measured.
For the 2026 World Cup, the most defensible position is cautious rather than dismissive. Nielsen’s out-of-home expansion captures real viewing that older systems undercounted, but it weakens direct comparisons with earlier tournaments.[6] Telemundo’s Total Audience Delivery approach recognizes that viewers move across television and streaming, but the 36% downward revision shows how much the public number can depend on the mechanics of that blend.[7] FIFA’s global audience reporting addresses markets beyond the reach of local panels, but its population-upweighted estimates should not be read as if every viewer were directly observed.[4]
World Cup viewership statistics are worth studying because they are not clean little facts. They are constructed measurements. Use them when the method travels with the number. Be suspicious when it does not.
References
- FIFA World Cup 2026™ captivates global audiences, FIFA,
- Records tumble as FIFA World Cup 2026™ Group Stage sets new benchmark, FIFA,
- What the viewership figures tell us about World Cup's success so far, NPR, July 1, 2026,
- Methodology - FIFA World Cup Qatar 2022™ Global Engagement & Audience Report, FIFA,
- Nielsen Fan Scorecard: FIFA World Cup 2026, Nielsen,
- World Cup's Biggest Ratings Boost Comes Outside the Home, Front Office Sports,
- Telemundo's World Cup viewership miscount has industry insiders skeptical, Awful Announcing,
Comments
Join the discussion with an anonymous comment.