
How Many People Watched the World Cup Final? What Research Says
Different sources report vastly different viewership numbers for the World Cup final. This article explains why the numbers differ, what the 2024 academic study actually found about viewership drivers, and how to interpret 2026 final data.
Updated:
Search “how many people watched World Cup final study” and you can land in a small numbers storm: 571 million, 1.5 billion, 1.12 billion, 1.8 billion, and sometimes tournament-wide totals that are not final-specific at all. The problem is usually not that one source is lying. The problem is that the sources are answering different questions.
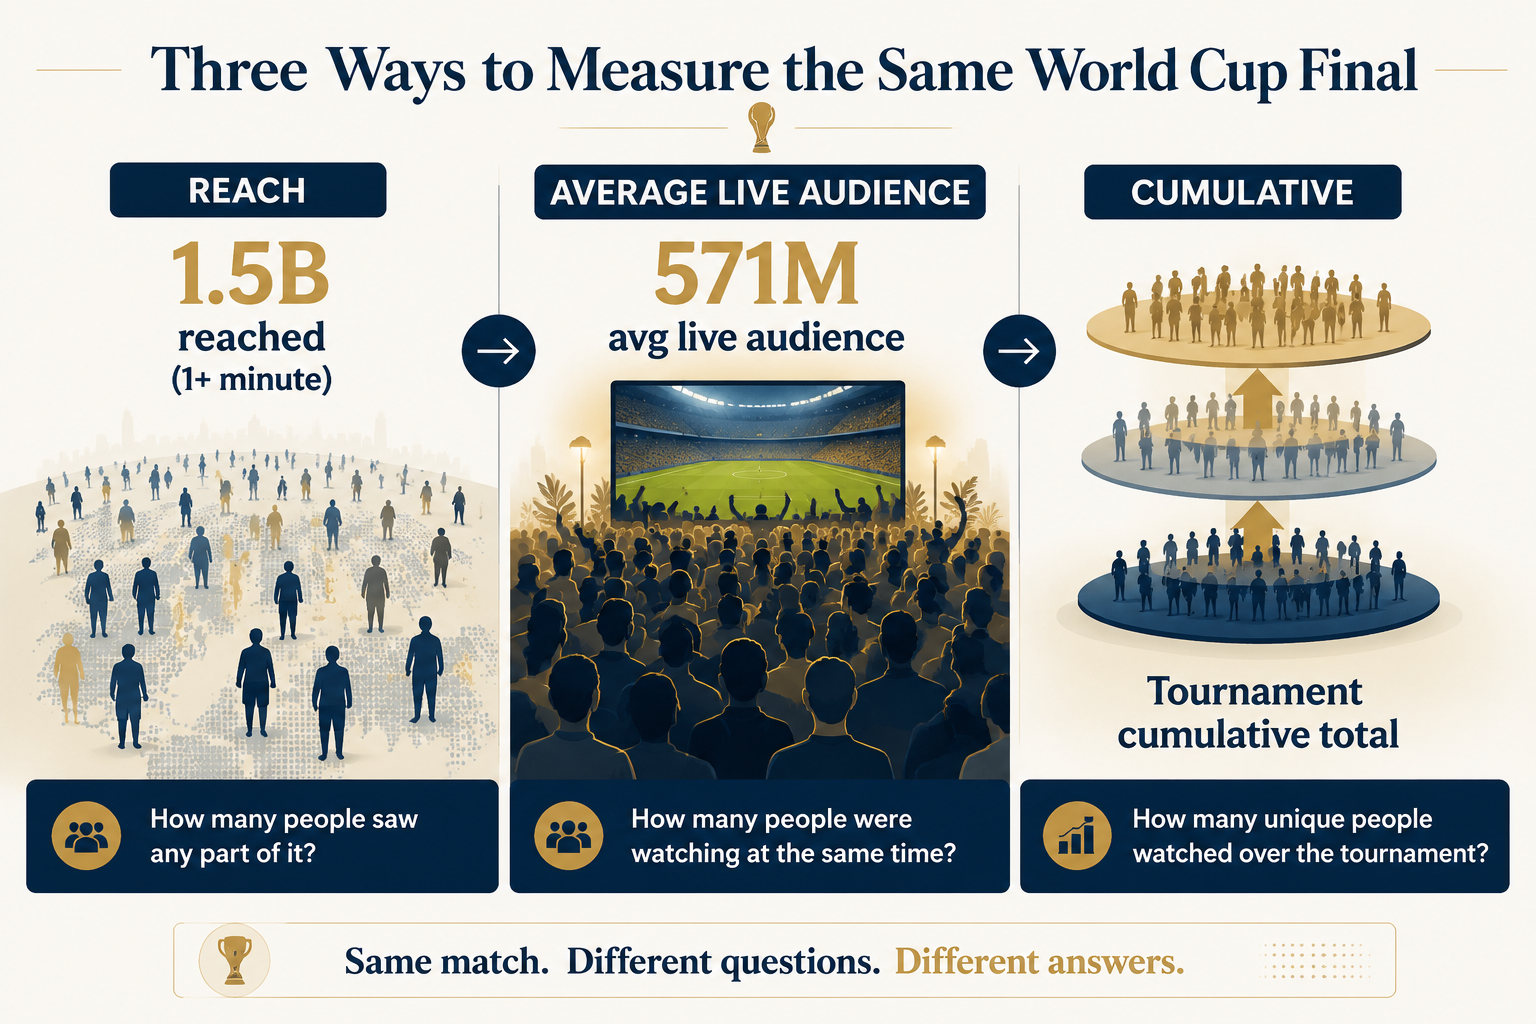
For the 2022 World Cup final between Argentina and France, the cleanest answer is this: FIFA reported 1.5 billion people reached and a 571 million average live audience for the final.[1] Those are both real figures, but they are not the same kind of figure.
The 2022 Final: Two Correct Answers, Two Different Metrics
The number you should use depends on the sentence you are trying to write. If your slide says “1.5 billion watched the 2022 World Cup final,” it needs a footnote in plain language: that means the final reached people who watched at least one minute, not that 1.5 billion people watched the whole match live from kick-off through penalties.[1]
Average live audience is a stricter and more comparable TV-industry-style measure. It asks, in effect, how many people were watching on average during the live broadcast window. For the 2022 final, that figure was 571 million.[1] Reach is wider. It counts people who were exposed to the broadcast for a minimum threshold, which is why it can be much larger.
| Metric | What It Measures | 2022 Final Figure | How To Use It |
|---|---|---|---|
| Reach | People who watched at least one minute | 1.5 billion | Use when describing broad exposure to the final |
| Average live audience | Average number watching during the live broadcast | 571 million | Use when comparing sustained live viewing |
| Cumulative tournament viewership | Viewing added across matches or tournament content | Not the same as final viewership | Use only for tournament-wide claims |
| Projection | An estimate made before full reporting is available | Not confirmed final data | Label clearly and avoid direct comparison with confirmed figures |
That distinction solves most of the confusion. “How many people watched?” sounds like one question, but it hides several measurement choices: watched for how long, on which platform, in which country, during which time window, and according to which reporting body.
Why the Bigger Number Is Tempting, and When It Is Still Useful
The 1.5 billion figure is not a fake number. It is useful if your question is about the global footprint of the event: how far the final traveled across audiences, broadcasters, and time zones. A final like Argentina vs. France was not just a match; it was a shared media event that people dipped into from offices, homes, fan zones, phones, and public screens.
But if your question is about sustained live attention, the 571 million average live audience is the better number. It is less dramatic, and that is part of its value. It tells your reader that you understand the difference between exposure and average simultaneous viewing.
This is the safest wording for a student paper or class presentation: “FIFA reported that the 2022 World Cup final reached 1.5 billion people, with an average live audience of 571 million.” That sentence keeps both true numbers in view and prevents the larger one from swallowing the smaller one.[1]

What the 2024 Study Actually Studied
The most relevant academic study here is not a global headcount of everyone who watched the final. Wang et al. studied what drove FIFA World Cup 2022 viewership ratings in mainland China, using Chinese television viewing data and match-level variables.[2] That boundary matters. The study is valuable because it is specific, not because it gives permission to make universal claims about every country.
Its central finding is wonderfully inconvenient for casual sports arguments: in mainland China, match kick-off time was the dominant predictor of ratings, not team quality.[2] In other words, the strongest team on paper did not automatically produce the strongest rating if the match was scheduled at a poor local viewing time.
This does not mean team quality never matters. It means that, in this measured setting, the practical condition of being awake and available mattered more. A glamorous match played at a difficult hour can lose viewers who would have watched it at a friendlier time. That is not a failure of fan interest; it is a reminder that audience behavior happens inside daily life.
Why Kick-Off Time Beat Team Quality in China
For Chinese viewers watching a tournament hosted in Qatar, local time conversion shaped the audience before the match even began. A late-night or early-morning kick-off asks more from a viewer than a prime-time match. Students sometimes treat “interest” as if it floats separately from time zones, workdays, school schedules, and sleep. The Wang et al. result is a useful correction.[2]
The study also found that matches involving World Cup champions such as Argentina, Brazil, France, and Germany produced more stable viewership, with less variance across different time slots.[2] That is a narrower and more interesting claim than “famous teams get more viewers.” It suggests that champion status may help protect audience interest when scheduling conditions are less favorable.
There is also a business reason to care about this market-specific evidence. Wang et al. noted that Chinese enterprises spent $1.4 billion on World Cup advertising in 2022.[2] If advertisers and broadcasters are spending at that scale, then knowing whether time slot, team strength, or champion reputation is doing the heavier work is not a trivia question. It changes how media value is interpreted.
What Not To Do With the Study
Do not turn the study into “kick-off time always matters more than team quality everywhere.” The evidence supports a China-specific finding for the 2022 World Cup, not a law of global sports audiences. It is fair to say the study shows how strongly local viewing conditions can shape ratings. It is not fair to use it as proof that team quality, star power, or national interest are irrelevant in every market.
The study’s wider lesson is methodological: global events are watched locally. A match can be the same match on the field and a very different viewing proposition in Beijing, Seoul, Santiago, London, New York, or Buenos Aires. Wang et al. also situate their work alongside country-specific audience research on Korean and Chilean viewers, reinforcing the point that local context often explains more than a simple “better match equals bigger audience” assumption.[2]
Where 2018 Fits
Once the metric categories are clear, the 2018 comparison becomes much easier to read. The France vs. Croatia final reportedly reached 1.12 billion people and had a 517 million average live audience.[3] Compared with 2022’s 1.5 billion reached and 571 million average live audience, the 2022 final was larger on both measures.[1][3]
Older finals are harder to rank cleanly. Pre-2002 viewership records are often disputed because measurement techniques, broadcast distribution, and reporting standards changed over time.[3] That does not make older tournaments unimportant. It simply means they should not be lined up against modern reach and average-audience figures as if every number came from the same measuring instrument.
How To Read 2026 Numbers One Day After the Final
As of July 20, 2026, the 2026 World Cup final has just been played. That timing matters. Global final viewership has not yet been confirmed in the same way FIFA reported the 2022 audience figures. Any worldwide number circulating immediately after the match should be treated as provisional unless it clearly identifies its source, method, and metric.
There are early signals that the 2026 tournament was operating at enormous scale. FIFA reported tournament-wide figures through July 8, 2026, including 6.25 million in-stadium attendance, 99.7% occupancy, 20 billion video views, and digital engagement up 485% from 2022.[4] Those figures are important, but they are not the same as confirmed global viewership for the final.
US-focused numbers are also useful, but they answer a narrower question. Before the final, Awful Announcing discussed US-only projections in the 46 million to 48 million viewer range, comparing that possible audience with NFL conference championship scale.[5] Deadline reported that the USMNT-Belgium round of 16 drew 30 million viewers, making it the most-watched soccer telecast in US history.[6] Those are strong domestic indicators, not global final totals.
The roughly 1.8 billion global figure that appeared before the final should be labeled as a projection, not confirmed audience reporting.[7] It should not be placed directly beside FIFA’s 2022 “1.5 billion reached” figure unless both numbers are using the same definition of reach, the same platform boundaries, and a comparable reporting method.
A Simple Test for Any 2026 Claim
- Does the number describe the final, the whole tournament, or digital content across the event?
- Is it reach, average live audience, cumulative viewing, attendance, video views, or engagement?
- Is it global, US-only, or limited to another national market?
- Was it published before or after the final?
- Is the source an official audience report, a media projection, a broadcaster disclosure, or a secondary summary?
That test is not meant to drain the fun out of the number. It is meant to stop a presentation from comparing unlike things. A projection can be worth mentioning. It just needs to stay in the projection box until confirmed reporting arrives.
The Super Bowl Comparison, Used Carefully
Comparing the World Cup final with the Super Bowl can help readers grasp scale, especially in a US classroom. Statista has placed the Super Bowl’s global reach at about 186 million including international audiences, roughly one-eighth of the World Cup final’s global audience.[8] That is a useful contrast, but only if the comparison stays at the level of broad scale.
It is less useful to pretend the two events are measured, distributed, and consumed in identical ways. The Super Bowl is a huge media event centered on one league, one country’s dominant sports calendar, and a massive domestic advertising market. The World Cup final is a global national-team event distributed across many broadcasters and time zones. Scale comparisons are fine; methodological shortcuts are not.
What To Cite in a School or Research Project
For most school uses, the best answer is not one lonely number. Use the paired 2022 figures and name the metric: “The 2022 World Cup final reached 1.5 billion people and had an average live audience of 571 million, according to FIFA.”[1] If you need a comparison, add that the 2018 final reached 1.12 billion and had a 517 million average live audience.[3]
Use Wang et al. when your point is about what can drive World Cup viewership in a specific market. A careful sentence would be: “In mainland China, Wang et al. found that kick-off time was the dominant predictor of 2022 World Cup ratings, while matches involving World Cup champions showed more stable viewership across time slots.”[2]
For 2026, say less until better data is available. It is reasonable to mention early tournament-wide digital, attendance, and US ratings signals, but global final viewership should be described as unconfirmed as of July 20, 2026.[4][5][6][7] The most careful version is also the most defensible one: 2022 is the confirmed anchor; 2026 is still an interpretation exercise.
References
- FIFA Audience Report (Qatar 2022), FIFA.
- Factors driving FIFA World Cup 2022 viewership ratings in mainland China, Frontiers in Sports and Active Living, 2024.
- The Most Watched World Cup Finals of All Time, The PFSA.
- Packed stadiums and record digital reach: World Cup 2026 numbers at unprecedented scale, FIFA, July 8, 2026.
- Why FIFA World Cup final could rival NFL conference championship viewership, Awful Announcing.
- World Cup 2026 TV Ratings, Deadline.
- How many viewers does World Cup get?, USA Today, June 10, 2026.
- Super Bowl Viewership vs. World Cup Final, Statista.
Comments
Join the discussion with an anonymous comment.