

How do political scientists study the Trump effect on midterm elections?
A guide for college students on how to critically read and compare competing political science studies about Donald Trump's impact on midterm elections, using real data from surveys, experiments, and historical patterns.
Updated:
Here is a very normal way to get confused about a Trump effect on midterm elections study: one paper says a Trump endorsement can make Democratic-leaning voters less likely to support a Republican candidate. Another source says Trump endorsements change campaign fundraising. Historical data says the president’s approval rating is usually a major clue for midterm seat losses. Then 2026 polling wanders in, unhelpfully wearing a fake mustache, and says Trump’s approval looks worse than it did in 2018 while Democratic advantages among Trump disapprovers look smaller.
That is not a sign that political science has failed to find “the answer.” It is a sign that the word effect is doing too much work. An endorsement effect, a fundraising effect, an approval-rating pattern, and a generic-ballot signal are not four versions of the same measurement. They are answers to different questions.
Start with the 2026 puzzle, because it is the kind of thing that tempts people to read backward from the conclusion they already like. CNN reported that Trump’s net approval in 2026 was twice as negative as in 2018, about -20 compared with -9, yet Democrats were winning a smaller share of Trump disapprovers in 2026 polling, roughly 69% to 85% depending on the poll, compared with about 90% in 2018.[1] If low approval simply translated into automatic Democratic votes, that gap should be easy to explain. It is not.
So the useful question is not “Does Trump matter?” Of course he matters. The useful question is: which Trump-related mechanism is this study actually able to observe?
The first move: identify the comparison
A study becomes much less mysterious once you ask what is being compared with what. This is not glamorous. It will not get applause on cable news. It does, however, prevent many terrible interpretations.
| Evidence type | Question it can address | What it cannot settle by itself |
|---|---|---|
| Survey experiment | Does exposure to a Trump endorsement change stated vote likelihood in a controlled scenario? | Whether the same effect appears in every real race, with real candidates, money, turnout, and local context |
| Observational campaign evidence | What happens around real endorsements, fundraising, and candidate performance? | Whether Trump alone caused every observed difference |
| Historical midterm data | How often does the president’s party lose seats, and how does approval correlate with losses? | Whether a particular 2026 candidate loses because of Trump |
| Current polling and special-election results | What conditions look like at a specific point before the election? | A certain forecast for November |
The trick is to resist making one row answer the question that belongs to another row. A clean experiment may tell you something sharp about voter reaction to an endorsement. It does not automatically tell you how a nationalized midterm will allocate House seats. A historical pattern may tell you presidents usually face midterm punishment. It does not prove that every Republican nominee is personally paying a Trump tax.
A clean experiment, with one very teachable wrinkle
The Blatte, Piccoli, and Zachem study is a good place to begin because its comparison is visible. The researchers used a 2×3 factorial survey experiment with 1,346 American adults. Participants saw a hypothetical general-election scenario in which candidate information varied, including whether the Republican candidate had Trump’s endorsement. The outcome was not an actual vote count. It was reported likelihood of voting for the Republican candidate.[2]
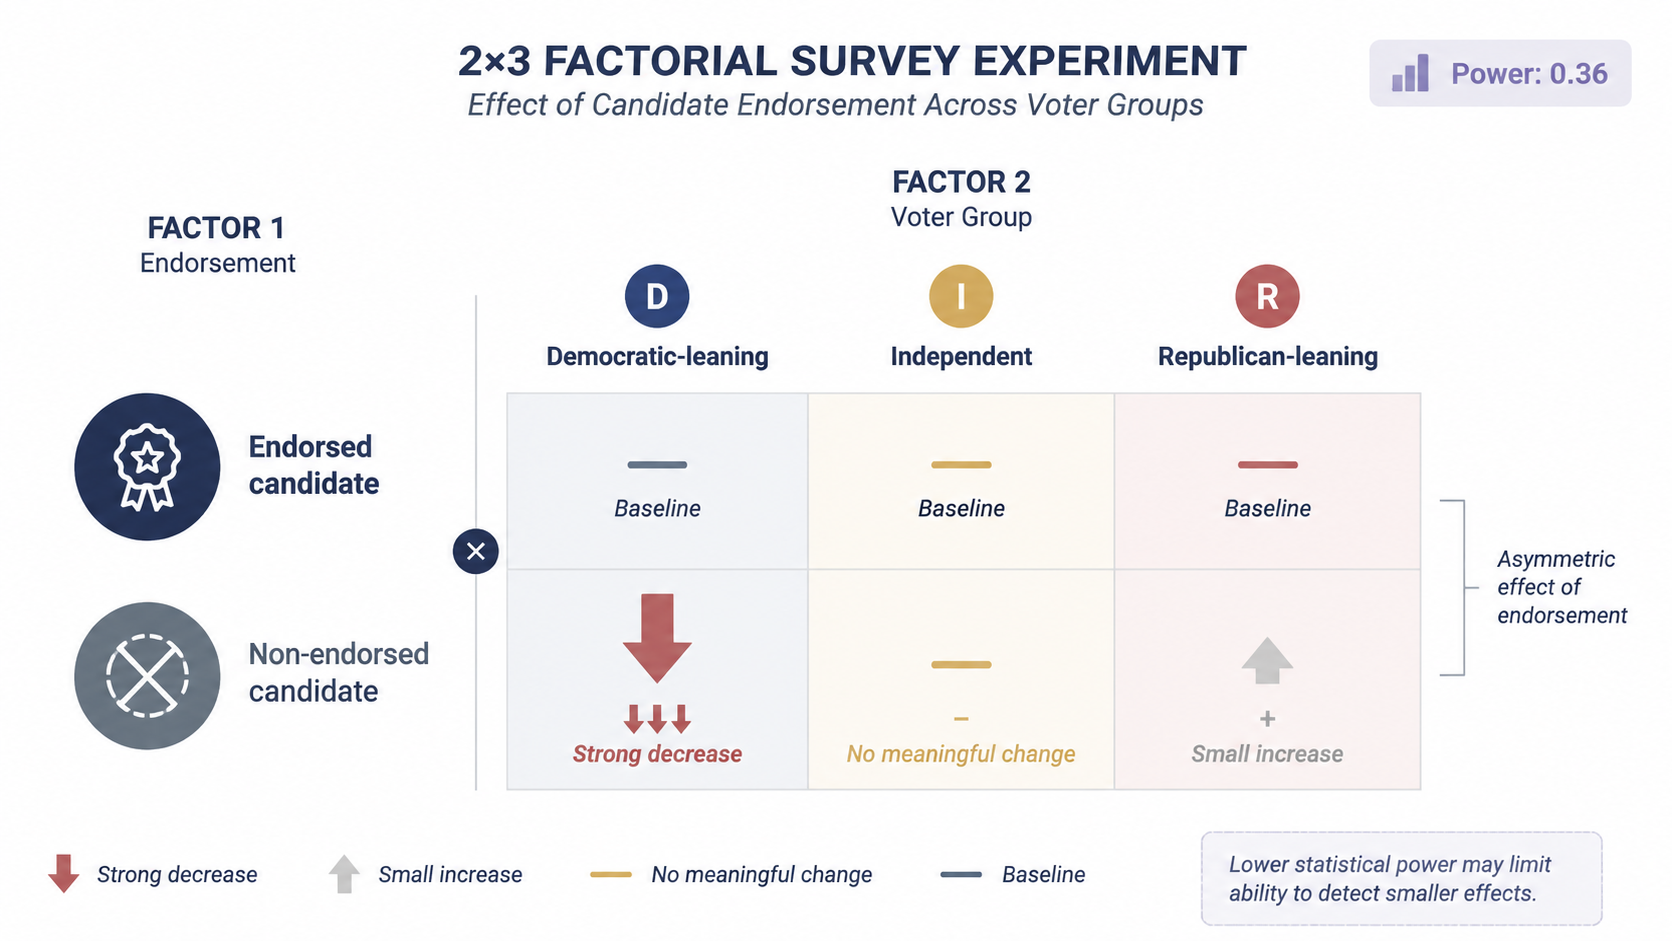
The vivid result is asymmetric. A Trump endorsement reduced Democratic-leaning respondents’ likelihood of voting for the Republican candidate by 11 percentage points, and that result was statistically significant at p<0.05. Among Republican respondents, the endorsement increased likelihood of voting for the Republican candidate by 5 points, but that increase was not statistically significant, with p=0.16.[2]
This is where many students make the leap: “Trump endorsements hurt and do not help.” Slow down. The study supports a narrower and more interesting statement: in this experimental setting, the endorsement produced a statistically detectable negative effect among Democratic-leaning voters, while the positive estimate among Republican respondents was smaller and not statistically distinguishable from zero at conventional levels.
That last phrase is annoying but important. “Not statistically significant” does not mean “nothing happened.” It means the study did not provide strong enough evidence, given its data and design, to rule out chance variation for that estimate. The authors report post-hoc power of only 0.36, meaning the study was underpowered to detect small-to-moderate endorsement effects.[2] In classroom terms: the study may have had a blurry enough lens that a real Republican-side effect could be hard to see.
This is not a footnote to politely ignore. It changes the claim you are allowed to make. A strong version says, “Trump endorsements do not help Republican candidates.” The evidence does not earn that sentence. A better version says, “In this experiment, the detectable effect was backlash among Democratic-leaning voters; any Republican-side boost was smaller in the estimate and not statistically significant, but the study had limited power to detect modest effects.”
What the experiment sees well
- It makes the comparison explicit: similar respondents react to different candidate information.
- It supports causal language within the experimental scenario because the endorsement cue is assigned by the researchers.
- It separates voter groups, which reveals that the endorsement may repel one group more clearly than it attracts another.
- It gives students a concrete example of why p-values and statistical power are not decorative math.
What the experiment does not see
- It does not measure actual turnout in November.
- It does not capture months of advertising, fundraising, local issues, incumbency, or candidate quality.
- It does not prove that a non-significant Republican-side estimate equals no Republican-side effect.
- It does not produce a complete forecast of House or Senate seats.
This is why the experiment is useful rather than final. It gives a strong lesson about one mechanism: the endorsement cue itself. The next question is what happens when endorsements leave the survey screen and enter campaigns with donors, opponents, reporters, and actual ballots.
Real campaigns answer a different question
An observational study of real elections has a messier job. It cannot randomly assign Trump endorsements to actual candidates. It has to compare candidates who received endorsements with candidates who did not, while trying to account for the fact that endorsed candidates may already differ from non-endorsed candidates.
The WashU Source summarized research on Trump’s influence in primary contests, including findings from a Butler working paper. It reports that Ballard, Hassell, and Heseltine’s 2021 study of Trump’s 2018 endorsements found that endorsements increased Democratic opposition fundraising enough to offset the financial boost to Trump-endorsed candidates. The same WashU piece also reports that Trump-endorsed candidates in 2022 performed about 5 percentage points worse in general elections than similar non-endorsed candidates in a matching-based simulation.[3]
Notice the new outcome sneaking in. We are no longer asking only whether a voter likes a Republican candidate more after seeing “endorsed by Trump.” We are asking what an endorsement does to the campaign environment. Maybe it helps a candidate survive a primary. Maybe it helps raise money from one side and mobilizes money from the other. Maybe it changes who pays attention to a race. Those are not side issues; they are part of how elections work.
But the caution label matters. The WashU account cites a working paper by Butler, and the findings reported there should be treated as preliminary because the work is not yet peer reviewed.[3] That does not make it useless. It means students should avoid upgrading it into settled knowledge just because the result is numerically tidy.
Matching-based evidence is especially easy to overread. Matching tries to compare endorsed candidates with similar non-endorsed candidates. That is a sensible strategy, but “similar” only applies to the features included and measured well enough for the comparison. If two campaigns differ in an unmeasured way that also affects the outcome, the comparison can still carry bias. This is the ordinary bargain of observational research: greater realism, less experimental control.
Why midterm scholars usually look at the president first
Before interpreting endorsements candidate by candidate, political scientists often begin with the broader midterm environment. The president’s party has lost House seats in 20 of the 22 midterm elections since 1938. The two exceptions were 1998, when Bill Clinton’s approval was 66%, and 2002, when George W. Bush’s approval was 63% after 9/11.[4]
This historical pattern is powerful because it is simple and persistent. It is also not a randomized experiment. Nobody randomly assigned presidents to have low approval ratings in some midterms and high approval ratings in others, which is probably for the best. The pattern shows a strong association between presidential approval and seat losses; it does not prove that approval mechanically causes a particular number of lost seats in every cycle.
Still, as a starting point, it is hard to ignore. If a president is unpopular, members of that president’s party usually have to run in a tougher national climate. That does not tell you whether a Trump endorsement hurt Candidate A in District B. It tells you the water level in which Candidate A is trying to swim.
Brookings applied that historical lens to 2026 conditions. As of July 2026, it reported Trump’s approval at about 36% approve and 61% disapprove. It also described an April 2026 generic-ballot Democratic lead of about 6 points, translating to an approximately 8.5-point swing from 2024, which historically would imply a Democratic net gain of about 21 House seats. Brookings also noted that 2025-2026 special elections showed about 15-point Democratic overperformance.[5][6]
Those numbers are date-sensitive. They describe the political environment as measured before the November 2026 election, not a certified future. Polling can move, turnout composition can change, candidates can matter, events can intervene, and district-level effects do not always line up neatly with national averages. But the figures explain why a serious analysis of Trump and the midterms cannot begin and end with endorsements. Presidential approval is one of the big structural signals sitting in the room.
The 2026 puzzle is not a contradiction; it is a research problem
Now return to the opening puzzle. If Trump’s 2026 net approval is worse than in 2018, why might Democrats be winning a smaller share of Trump disapprovers than they did in 2018? The sources here do not let us give one confirmed answer. Good. This is where students get to practice not inventing certainty.
Approval is an attitude measure. Voting is behavior. Generic ballot preference is a national survey measure. House control is an aggregation of district races. Endorsement effects may operate through candidate perception, fundraising, primary selection, turnout, or backlash. These concepts are related, but they are not interchangeable.
CNN’s comparison suggests that disapproving of Trump in 2026 may not translate into Democratic voting as uniformly as it did in 2018.[1] Brookings’s data suggests the national environment still looks difficult for Republicans as of mid-2026.[5][6] The Blatte experiment suggests a Trump endorsement can repel Democratic-leaning voters in a controlled general-election scenario.[2] The WashU-reported research suggests endorsements can also reshape campaign finance and candidate performance in real races, though some findings remain preliminary.[3]
These findings do not need to be flattened into a single sentence. A student who says, “The Trump effect is negative,” may be gesturing at something real, but the statement is too blunt. Negative for whom? In what kind of race? Measured by vote likelihood, fundraising, primary success, general-election margin, generic ballot, or House seats? Compared with what counterfactual?
A student reading checklist for the Trump case
When you read a study or commentary about Trump’s effect on the midterms, do not begin by asking whether the conclusion sounds politically satisfying. Begin with the machinery of the claim.
- Name the outcome. Is the study measuring vote likelihood, actual vote share, fundraising, primary success, seat loss, approval, or generic-ballot preference?
- Find the comparison. Are endorsed candidates compared with non-endorsed candidates, treated survey respondents with untreated respondents, or one midterm year with earlier midterms?
- Separate causal evidence from descriptive evidence. Experiments can support cleaner causal claims inside their design; historical patterns and campaign observations often show associations that require more caution.
- Check uncertainty before quoting the headline result. A non-significant estimate is not proof of no effect, and a preliminary working paper is not the same as a peer-reviewed consensus.
- Ask what the method misses. Survey experiments may miss campaign context; observational studies may miss unmeasured differences; aggregate data may hide district-level variation.
- Keep the date on current polling. A July 2026 approval number or an April 2026 generic-ballot lead is evidence about that moment, not a final result from November.
Applied to the Trump case, the checklist produces a more careful conclusion. The survey experiment offers causal evidence that a Trump endorsement reduced Democratic-leaning voters’ reported willingness to support a Republican candidate, while the Republican-side boost was smaller and not statistically significant in an underpowered study.[2] The campaign evidence points toward real-world consequences for fundraising and candidate performance, but the WashU-reported 2022 matching finding should remain in the preliminary box until the underlying working paper has gone through peer review.[3] The historical midterm data gives a strong descriptive reason to begin with presidential approval and the national environment, especially because the president’s party has lost House seats in 20 of 22 midterms since 1938.[4]
That is less punchy than “Trump dooms Republicans” or “Trump has no effect.” It is also more useful. The Trump effect on midterm elections is not one settled measurement waiting to be memorized. It is a set of method-dependent findings. The better reader is not the one who picks a favorite number fastest, but the one who can say what each number sees, what it misses, and how much confidence the design deserves.
References
- Why the Trump effect is different in 2026 than 2018, CNN, July 19, 2026.
- The Causal Effects of a Trump Endorsement on Voter Preferences in a General Election Scenario, Cambridge Journals, 2024.
- Research explains Trump's influence on primary contests, WashU Source, June 2026.
- Seats in Congress Gained/Lost by the President's Party in Mid-Term Elections, UCSB American Presidency Project.
- GOP midterm prospects darken as Trump approval falls, Brookings.
- What history tells us about the 2026 midterm elections, Brookings.
Comments
Join the discussion with an anonymous comment.