
Why Does NYC Flood? A Study of Urban Flooding Causes
This article breaks down the four key factors behind urban flooding in New York City: impervious surfaces, an outdated combined-sewer system, climate-driven rainfall intensification, and sea level rise. It also highlights a 2026 study showing that 4.4 million New Yorkers and 215,000+ buildings sit at the highest flood-risk level.
Updated:
If rain falls in many cities, why does New York flood so intensely and so repeatedly? The short answer is not one storm drain, one hurricane, or one flooded subway stairwell. New York floods because water arrives faster, finds fewer places to soak in, enters pipe networks with old design limits, and increasingly meets a coastline where the starting water level is already higher.
That combination is why the stakes are so large. A 2026 Science Advances study by Dey and Shao found that 4.4 million New Yorkers, about 50% of the city’s population, and more than 215,000 buildings sit at the highest risk level for extreme flood damage. Among the eight East Coast cities studied, New York City was the largest national hotspot for exposed population and buildings.[1]
For a student studying urban flooding causes, that finding is the place to start. The risk is not just “because climate change.” It is also not just “because the sewers are old.” It is the overlap: 72% hard surface cover, a combined-sewer system built around smaller storms, heavier extreme rainfall, and sea level rise pressing into the drainage problem from the coast.
The First Flood Machine Is the Surface of the City
Before the water reaches a pipe, it meets the street. In a forest, rain is slowed by leaves, soil, roots, hollows, and uneven ground. In much of New York City, it hits asphalt, concrete, roofs, sidewalks, parking lots, schoolyards, and compacted surfaces that do not absorb much water. The city’s Hazard Mitigation Plan says 72% of New York City is covered by impervious surfaces.[2]
That number matters because impervious cover changes the route of water. Rain that might have soaked into soil becomes runoff. Runoff moves quickly along curbs, down sloped streets, across intersections, into catch basins, and toward sewer pipes. A curb cut or a blocked storm drain can decide whether water keeps moving or spreads sideways toward a basement entrance, subway stair, school doorway, or below-grade loading dock.
This is why a flood map of New York is never only a weather map. It is also a land-cover map. Hard surfaces shorten the time between rainfall and drainage demand. They turn a cloudburst into a pipe-capacity test within minutes.
The Pipe System Was Not Built for Today’s Rainfall Peaks
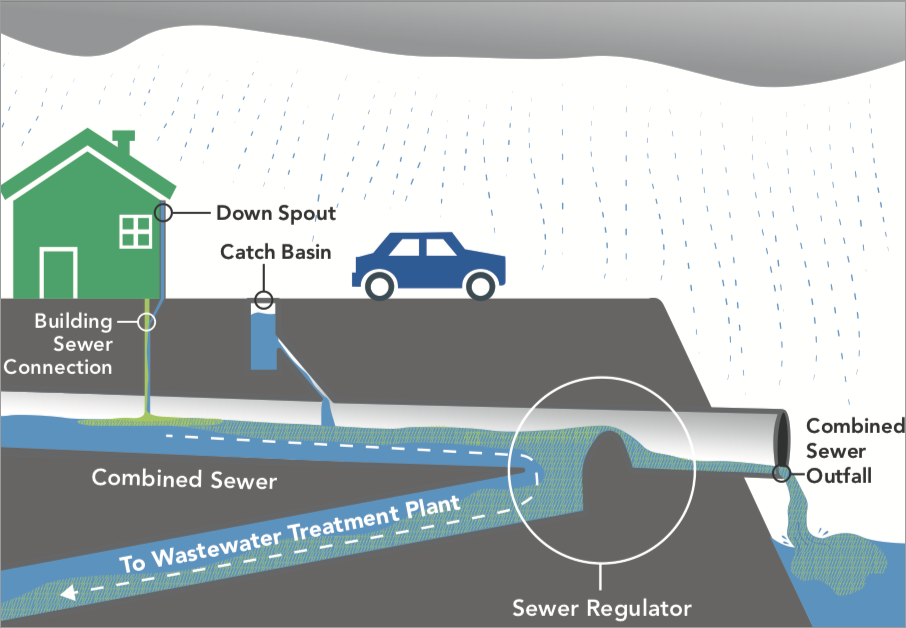
Much of the city’s drainage problem is hidden under the street. About 60% of New York City is served by a combined-sewer system, meaning the same pipes carry household wastewater, business wastewater, and stormwater runoff during rain.[3]
In dry weather, that design is straightforward: wastewater travels to a treatment plant. In wet weather, runoff from streets and roofs enters the same system. When the volume becomes too large, the system can overflow, sending a mix of stormwater and sewage into surrounding waterways. The city did not invent this problem recently; combined sewers are an older urban engineering pattern. The newer problem is that heavier rainfall keeps pushing that older pattern past its assumed operating range.
Design thresholds make the mismatch easier to see. NBC News reported that New York City’s sewer system was built to handle a 5-year storm in newer areas and a 3-year storm in older areas.[3] The subway system has its own drainage threshold: it was designed for about 1.75 inches of rain per hour.[4]
Those are not abstract numbers. They are the line between water that the system can route away and water that begins to accumulate where people actually stand. The Guardian reported that storms exceeding the subway’s 1.75-inch-per-hour drainage threshold went from zero before 1991 to six since then, including a July 2025 storm that reached 2.07 inches per hour.[4]
Once rainfall exceeds that kind of threshold, the failure does not need to look cinematic to matter. A stairwell becomes a chute. A street depression becomes a basin. A platform-level leak becomes a service disruption. A basement apartment, already below the grade where runoff is moving, can become the lowest available storage space in the neighborhood.
A Simple Way to Track the Chain
| Layer | What it does during heavy rain |
|---|---|
| Impervious surfaces | Move water quickly into streets and drains instead of soil |
| Catch basins and local drains | Collect runoff, but can be blocked, undersized, or quickly overwhelmed |
| Combined sewers | Carry stormwater and wastewater in the same pipes across much of the city |
| Subway and below-grade spaces | Receive water when street drainage cannot keep up |
| Coastal water levels | Can reduce drainage room and add tidal flooding at the edge |
That chain is why “why does NYC flood” is a systems question. The causes are not waiting politely in separate boxes. A hard surface increases runoff; the runoff enters a pipe network; the pipe network meets rainfall that can exceed design assumptions; and the overflow appears at street level, transit level, basement level, or shoreline level depending on local elevation and exposure.
Climate Change Adds More Water to the Same System
Climate change enters the New York flooding story most clearly through rainfall intensity and totals. The New York City Panel on Climate Change’s fourth assessment projects annual precipitation in the city region to increase by 4% to 11% by the 2050s and 7% to 17% by the 2080s, relative to the 1981–2010 baseline.[5]
Annual precipitation is not the same as the intensity of one thunderstorm, so the projection should not be misread as a direct prediction that every storm will be that much larger. Its importance is that it points in the same direction as the observed threshold problem: the drainage system is being asked to work in a wetter climate than the one many design assumptions came from.
For class notes, the useful distinction is existence versus performance. New York has drainage infrastructure because past engineers did build a system. That does not mean the system remains effective under rainfall rates and coastal conditions outside its original design range. Infrastructure can exist, operate, and still be overwhelmed.
This is also why saying “climate change caused the flood” can be too blurry. Climate change can raise the probability or severity of extreme precipitation conditions, but the flood depth at one intersection still depends on pavement, slope, catch-basin condition, sewer capacity, local elevation, and whether the receiving waters have room to take more flow. The climate signal adds load; the city system determines where that load fails first.
Sea Level Rise Makes Drainage Harder From the Other Side
Rain-driven flooding is not the only kind of water New York has to manage. The city is built around tidal waterways: the harbor, rivers, bays, inlets, canals, and low-lying waterfront edges. As sea level rises, the baseline water level along those edges moves upward. That means coastal flooding can happen more often, and drainage systems near the coast may have less vertical room to discharge water during high tides or storm conditions.
At The Battery, NPCC4 projects sea level rise of 14 to 19 inches by the 2050s. NYC DEP also notes that today’s roughly 10 annual high-tide flood days could become 60 to 85 annual high-tide flood days by the 2040s.[6]
That shift changes what counts as a normal edge condition. A drainage outfall that used to empty into lower water may face higher water more often. A street that used to flood only during a strong coastal storm may see nuisance flooding under less dramatic tides. The coastline becomes a recurring pressure on the same system already handling rainfall runoff.
Sea level rise should not be treated as a separate coastal-disaster chapter detached from sewer flooding. In New York, the coast and the pipes meet. When rainfall, runoff, tide, and outfall conditions line up badly, the city can flood from above and from the edge at the same time.
Exposure Turns a Drainage Problem Into a Social Risk
The 2026 exposure finding becomes clearer after the physical causes are in place. The 4.4 million people and more than 215,000 buildings identified at the highest risk level are not exposed because of one broken component. They sit where land cover, drainage limits, rainfall hazards, coastal water, building patterns, and social vulnerability overlap.[1]
Urban Systems Lab has argued that flood risk in New York has to be read through infrastructure and social vulnerability together, not just through hazard maps alone.[7] That matters because two neighborhoods can experience the same storm and face very different consequences. One may have newer drainage investments, higher household resources, fewer below-grade homes, and easier evacuation options. Another may have older infrastructure, more residents in vulnerable housing, limited mobility, and fewer financial buffers after damage.
Basement apartments show the point sharply. The city’s Hazard Mitigation Plan reports that during Ida, 11 of 13 fatalities were residents of basement apartments.[2] That fact should not be flattened into a footnote about housing type. It shows where the engineering abstraction ends: water seeks the lowest space, and people live in some of those spaces.
Groundwater flooding is another unresolved layer. NPCC4 identifies significant groundwater flood risk in eastern Brooklyn and southern Queens.[5] That mechanism is not the same as a backed-up storm drain or a tidal overtopping event, and it deserves deeper treatment than a short explainer can give it. Still, it reinforces the larger lesson: New York’s flood risk is layered vertically as well as horizontally, from groundwater and basements to streets, subways, and waterfront edges.
What the City Is Building, and What That Does Not Solve
New York is not ignoring the problem. DEP describes a $400 million Cloudburst program intended to manage intense rainfall with neighborhood-scale drainage and storage approaches. The city is also building the $1.45 billion East Side Coastal Resiliency project to reduce coastal flood risk along part of Manhattan’s East Side.[6]
Those projects are important, but they should be read as adaptation evidence, not as proof that the exposure has disappeared. A cloudburst project can create places for stormwater to slow down or collect. A coastal resiliency project can reduce flood pathways along a particular shoreline. Neither changes the basic citywide equation by itself: millions of people and hundreds of thousands of buildings remain located within overlapping flood-risk layers.
For students, this is a useful way to avoid two common mistakes. The first mistake is treating every flood as a freak event, as if the only thing to study is the storm. The second is treating infrastructure as a fixed shield, as if pipes, pumps, berms, and barriers either “work” or “fail” in a simple way. Urban flood protection is more conditional than that. It depends on rainfall rate, tide timing, surface runoff, maintenance, local elevation, housing exposure, and the design threshold of each piece.
If you are studying flash-flood preparedness for students, the personal safety lesson is to avoid moving water, below-grade spaces, and flooded transit areas. If you are studying urban-resilience economics, the policy lesson is that adaptation spending has to be judged against exposure, avoided damage, and who benefits first. Both questions start from the same physical model.
A Study-Friendly Answer
NYC floods because the city gives water fast pathways and limited storage. Its hard surfaces push runoff into drains. Its combined sewers carry stormwater and wastewater together across much of the city. Its design thresholds can be exceeded by present-day rainfall rates. Its coastline is facing higher baseline water levels. Its most exposed residents and buildings are not evenly distributed across the map.
That is why the 2026 finding of 4.4 million New Yorkers and more than 215,000 buildings at the highest risk level is not the result of one failure point.[1] It is the result of layers lining up: land cover, sewer design, heavier rain, sea level rise, housing exposure, infrastructure age, and social vulnerability. The causes compound, and the consequence is a city where flooding is best understood as a system under load.
References
- Dey & Shao, Science Advances, Science Advances, 2026.
- Flooding, NYC Hazard Mitigation Plan.
- NYC flooding shows climate change and infrastructure limitations, NBC News.
- New York floods storm climate change, The Guardian, July 16, 2025.
- New York City, New York State Climate Impacts Assessment.
- Flood Prevention, NYC Department of Environmental Protection.
- Flood Risk, Infrastructure, and Vulnerability, Urban Systems Lab, October 17, 2024.
Comments
Join the discussion with an anonymous comment.