
How Geography Shapes Heavy Convective Rainfall
This study guide explains the predictable geographic patterns of heavy rain from convective storms, covering the roles of the ITCZ, monsoon circulations, mesoscale convective systems, and orographic effects. It synthesizes key research to help geography and meteorology students understand where and why extreme precipitation concentrates.
Updated:
The map is not random
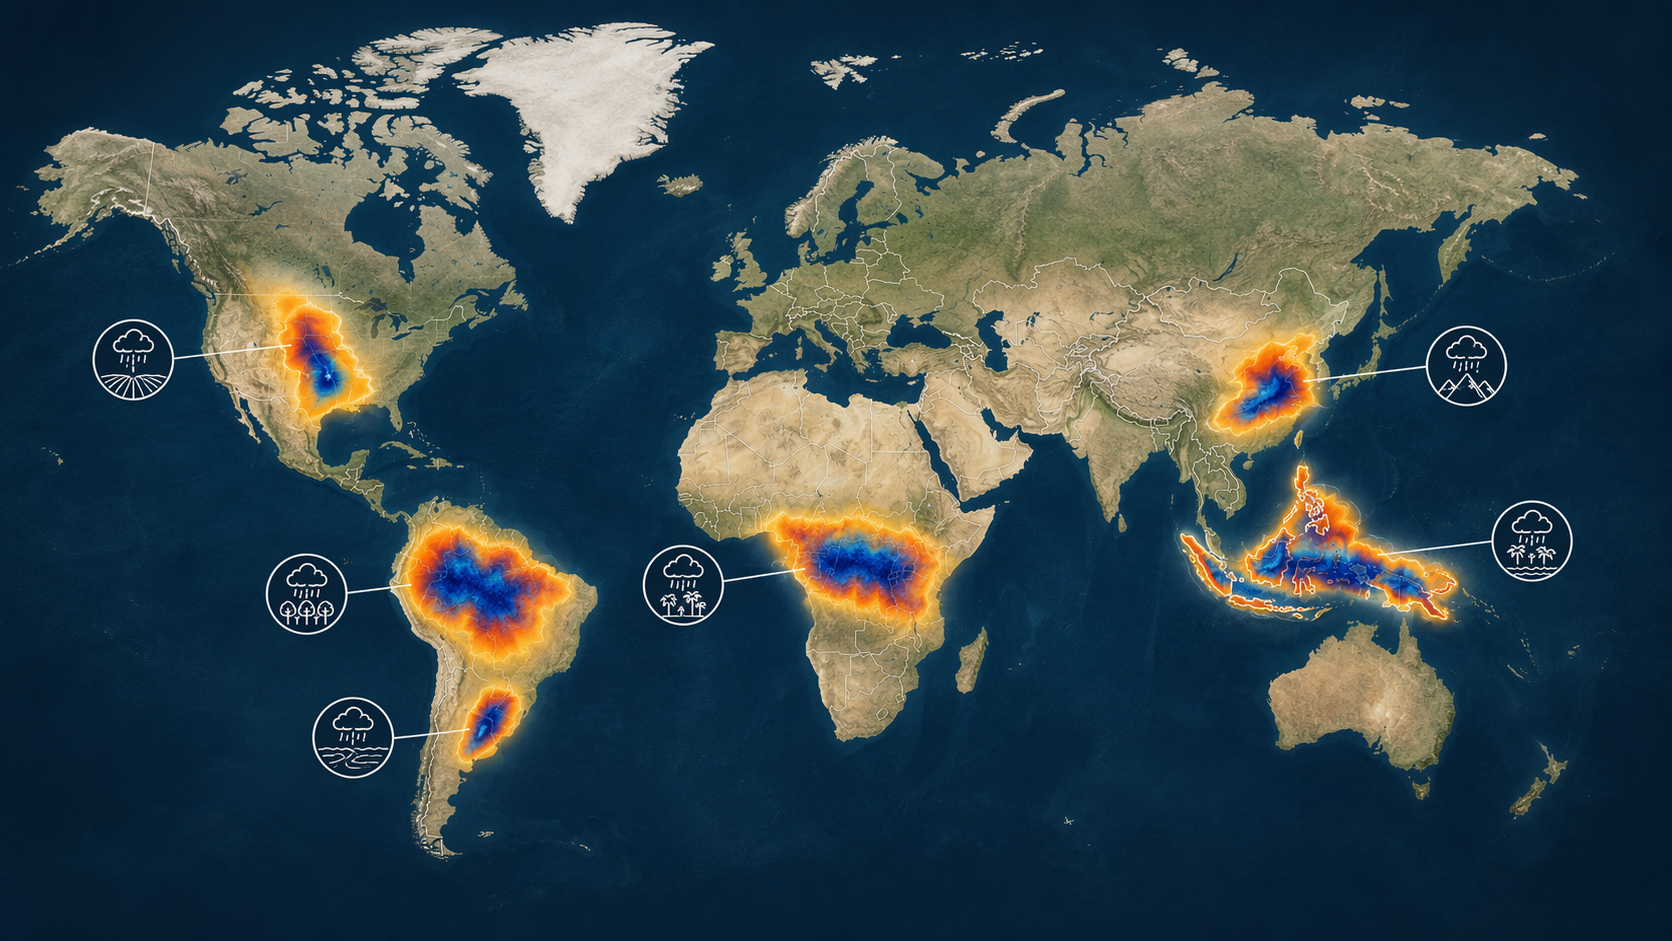
If heavy rain from convective storms were truly random, the map would blur evenly across every humid region. It does not. The strongest clustering shows up in tropical Africa, the Maritime Continent, and tropical South America, with other recurring hotspots in East Asia, the US Great Plains, and subtropical South America [1]. The first useful correction is that storm event density, rain rate, and rain volume are not the same thing, so the "wettest" region depends on what is being counted [1][4].
The better question is not simply where convection exists, but where the atmosphere keeps supplying moisture, forcing lift, and maintaining instability long enough for rain to accumulate. Doswell et al. compress that idea into P = I × D: intensity and duration both matter, and duration depends on how long the lifting mechanism survives [2]. The ITCZ is just a moving convergence belt where rising air and moisture overlap; monsoon circulations do something similar seasonally, while sea-breeze boundaries and orographic lift do it on smaller spatial scales.
Why organized storms matter
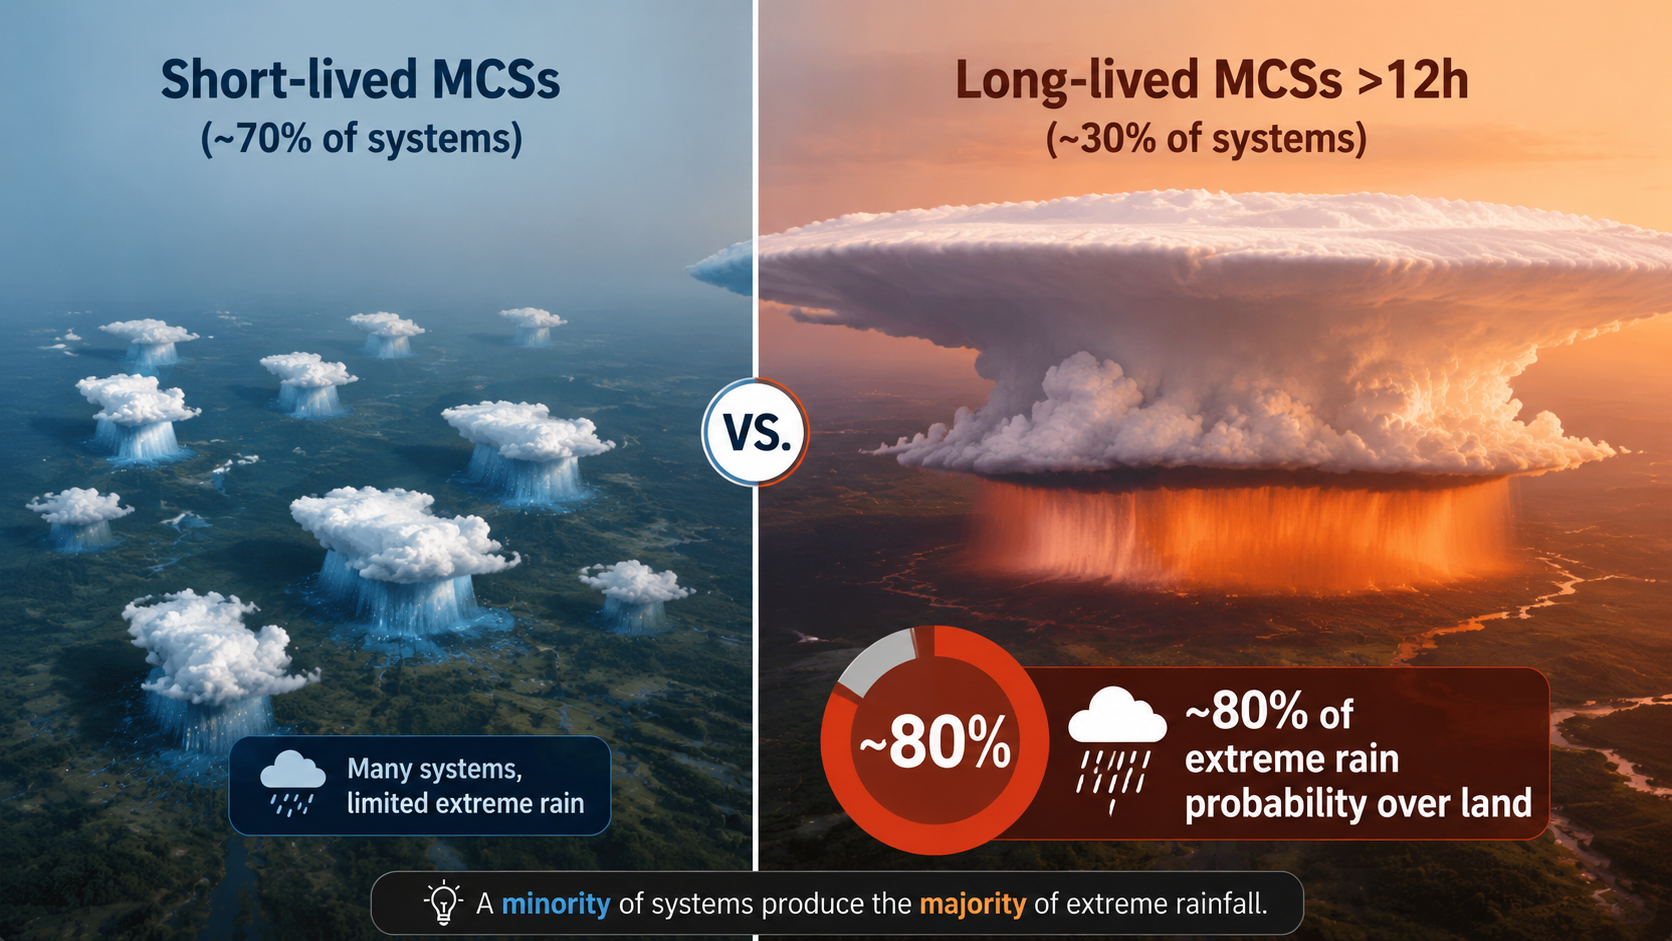
That framework matters because the largest rainfall totals usually come from organized systems, not lone cells. Roca and Fiolleau found that mesoscale convective systems lasting more than 12 hours are only about 30% of the MCS population, yet they account for about 80% of extreme rain probability over land [3]. That is the kind of number that changes the story: the storm that matters most is often the one that can keep rebuilding over the same corridor, not the flashiest cell on radar.
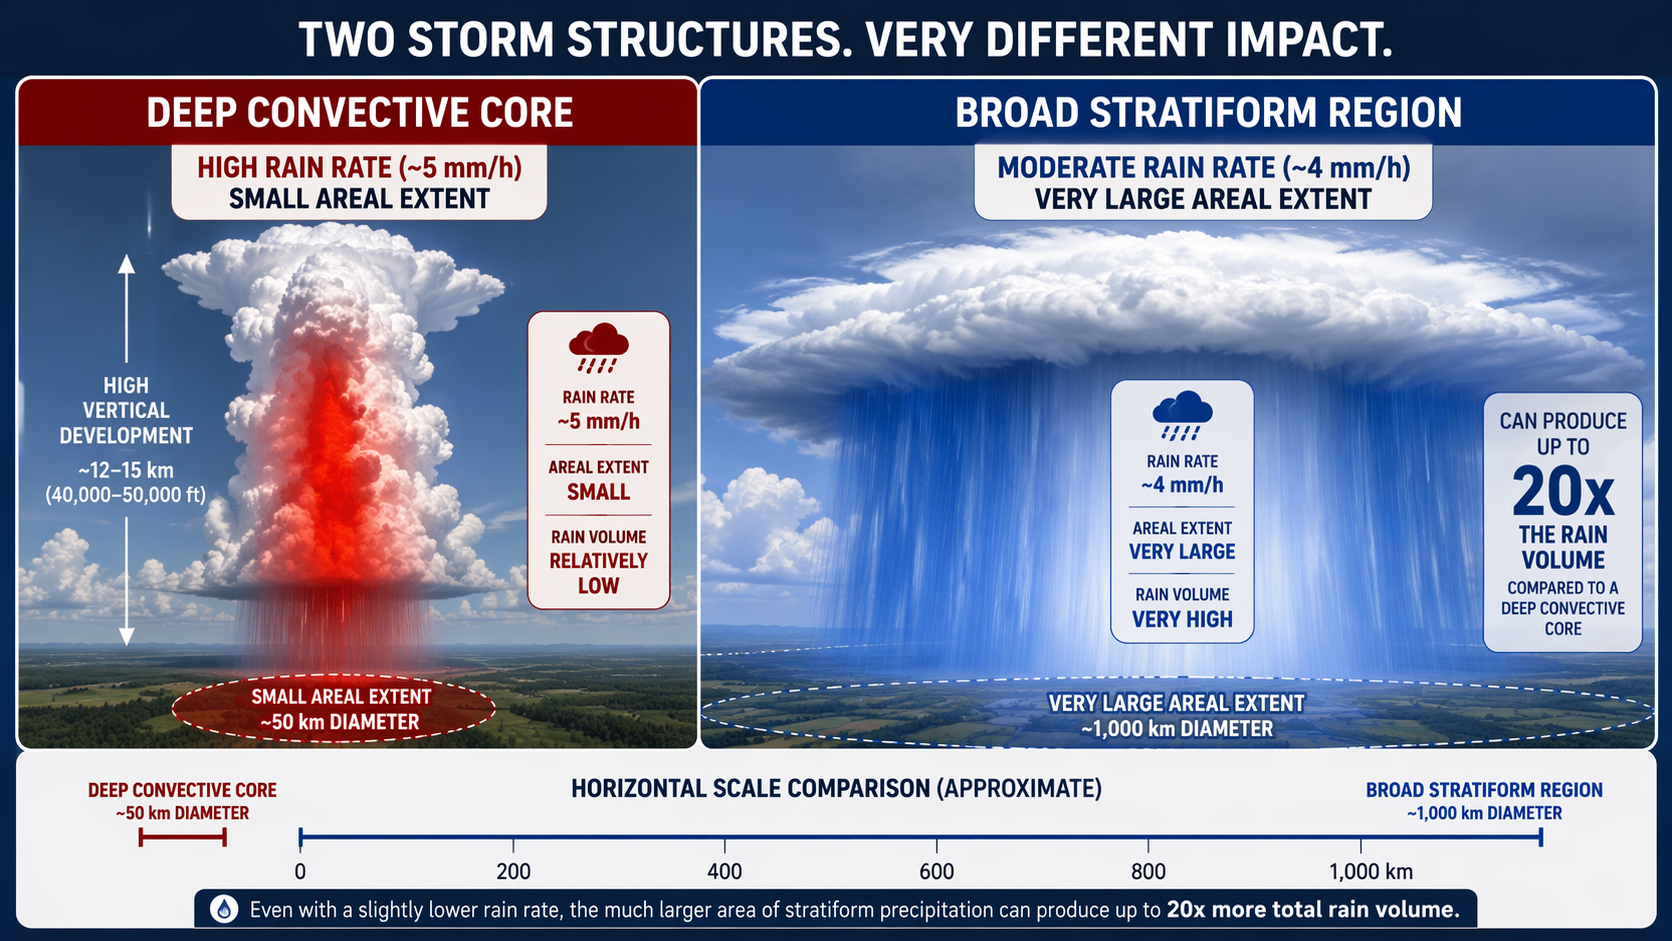
Storm structure makes the same point from another angle. Panasawatwong et al. show that deep convective cores can reach about 5 mm/h over land and about 4.5 mm/h over ocean, but broad stratiform regions can generate up to 20 times the rain volume of isolated deep convection [4]. A narrow core can dominate peak rate, while a wide stratiform shield dominates accumulated totals. That is why geography often favors organized convective complexes rather than isolated pops of thunder.
Regional patterns that fit the same mechanism
Once you start reading the map by mechanism, the regional pattern makes sense. Tropical Africa, the Maritime Continent, and tropical South America sit in environments where moisture is abundant and deep convection is frequent [1]. The Maritime Continent adds a strong land-sea thermal contrast, so convection can regenerate again and again. East Asia is a useful compact case because the Meiyu season concentrates moisture, frontal lift, and organized storm complexes into one corridor [4].
The US Great Plains and subtropical South America add another lesson: extreme rain can also form where moisture transport meets a boundary that keeps triggering new systems, not just where the tropics are deepest. In both places, the geography is doing more than marking a location on the map; it is helping decide whether storms remain scattered or organize into long-lived rainfall producers.
A historical Middle Tennessee climatology is useful here only as a process-classification example. Troutman et al. broke heavy precipitation from 1961-1990 into synoptic, frontal, and meso-high categories [5]. That shows how a climatology can be built around storm type instead of just rainfall totals, but it is still a regional archive from a past period, not a basis for global ranking.
Satellite-era studies are what make the large-scale map visible, but they still smooth some details, especially when retrievals are sampling complicated storm structure over land. So the safest way to read a hotspot is to ask four linked questions: where is the moisture coming from, what is forcing the rise, what is organizing the convection, and can the system stay over the region long enough to produce an extreme total? When those answers line up, geography is no longer just the setting; it is part of the mechanism that turns a thunderstorm into a heavy-rain event.
References
- Geographical distribution of extreme deep and intense convective storms. ScienceDirect. 2019. link
- Flash Flood Forecasting: An Ingredients-Based Methodology. American Meteorological Society. 1996. link
- Extreme precipitation in the tropics is closely associated with long-lived convective systems. Nature Communications Earth & Environment. 2020. link
- A Climatology of Extreme Convective Storms in Tropical and Subtropical East Asia and Their Ingredients for Heavy Rainfall as Seen by TRMM. Journal of Geophysical Research: Atmospheres. 2022. link
- A Comprehensive Heavy Precipitation Climatology for Middle Tennessee. NOAA/NWS. 2001. link
Comments
Join the discussion with an anonymous comment.