
A Student's Guide to Hurricane Season Forecasts
Learn how scientists forecast an entire hurricane season months in advance, why different centers issue different numbers, and how to interpret probability-based outlooks critically for exams or assignments.
Updated:
A useful way to study hurricane season forecasts does not begin by asking which number to memorize. It begins with the disagreement that looks, at first, like a problem: NOAA predicted a below-normal 2026 Atlantic hurricane season with 8–14 named storms, 3–6 hurricanes, and 1–3 major hurricanes, assigning a 55% chance to a below-normal season, 35% to a near-normal season, and 10% to an above-normal season.[1] Colorado State University, meanwhile, revised its Atlantic forecast downward on July 8, 2026, from 13 named storms in April to 9 named storms, as confidence increased that El Niño would develop.[2]
Those two outlooks are not a scoreboard. NOAA is not “right” because it gives a range, and CSU is not “wrong” because it changed a number. They are doing what seasonal forecast centers are supposed to do: weighing signals, stating uncertainty, and updating when the evidence changes. If you can explain that in an exam answer, you are already doing better than the student who copies a storm-count table and stops there.
What NOAA’s 2026 Outlook Is Actually Saying
NOAA’s 2026 Atlantic outlook is a good place to practice reading forecast language because it refuses to give students the false comfort of one exact season. The headline category is below-normal, but the forecast is expressed as probabilities and ranges: 55% below-normal, 35% near-normal, 10% above-normal; 8–14 named storms; 3–6 hurricanes; 1–3 major hurricanes.[1]
Each of those numbers answers a different question. The probability categories describe NOAA’s judgment about the season as a whole compared with normal activity. The storm-count ranges describe plausible activity levels if the forecast reasoning holds. The major-hurricane range narrows attention to the strongest storms, but it still does not tell you where any storm will go.
| Forecast wording | What a student should read from it | What it does not mean |
|---|---|---|
| 55% below-normal | NOAA judged below-normal activity to be the most likely category. | A below-normal season is guaranteed. |
| 35% near-normal | NOAA still allowed a substantial chance that the season lands near normal. | Near-normal activity has been ruled out. |
| 10% above-normal | An above-normal season was considered possible but less likely. | The Atlantic cannot become active. |
| 8–14 named storms | The forecast is a range, not a single promised count. | Every number inside the range is equally certain. |
| 1–3 major hurricanes | The outlook estimates basin-wide major hurricane activity. | It predicts landfalls or impacts for specific places. |
That last column matters. A seasonal Atlantic forecast is basin-wide. It can say something about the environment over the season, but it is not a landfall forecast. A quiet basin can still produce a damaging landfall, and an active basin can include storms that remain over open water. If an assignment asks what a seasonal outlook can and cannot tell us, put that caveat near the top, not as a footnote.
Why CSU Changed Its Forecast
The CSU revision is the cleaner classroom example because it shows forecasting as revision rather than a fixed announcement. CSU’s April forecast called for 13 named storms. By July 8, the forecast had been reduced to 9 named storms, with the update tied to increased confidence in El Niño development.[2] That is not backtracking in the casual sense. It is a scientific forecast responding to a changing estimate of the atmosphere-ocean background state.
For Atlantic hurricanes, El Niño is usually treated as a suppressing factor because it tends to increase vertical wind shear over parts of the Atlantic basin. Vertical wind shear means winds change with height. Tropical cyclones need a vertically organized structure; stronger shear can tilt or disrupt that structure, making it harder for storms to form or intensify. So when forecasters become more confident that El Niño conditions will influence the season, they may lower expected Atlantic activity.
But El Niño is not the only signal. Seasonal forecasters also examine sea surface temperatures, trade winds, moisture, atmospheric pressure patterns, and model guidance. Warm ocean water can favor development because tropical cyclones draw energy from warm seas, while unfavorable winds or dry air can work in the opposite direction. UCAR’s student materials describe warm ocean water, moist air, and converging winds as important ingredients for hurricane formation, which is enough formation background for this purpose; the forecast question is how favorable those ingredients are likely to be across a basin and season.[3]
That is why two credible centers can land on different expressions of the same season. NOAA’s range of 8–14 named storms and CSU’s July number of 9 named storms are not identical products. One is a federal probabilistic seasonal outlook framed with category probabilities and ranges; the other is a university forecast update with its own methods and emphasis. The useful student move is to ask what each forecast is measuring, which signals it highlights, and how much uncertainty it leaves visible.
The Drivers Are Not a Vocabulary List
Students often learn the right terms and still write a weak answer because the terms sit there like labels on a diagram. ENSO, sea surface temperature, wind shear, and trade winds matter only if you connect each one to a mechanism and then to the forecast.
- ENSO: El Niño can suppress Atlantic activity by increasing vertical wind shear; La Niña often removes some of that suppressing influence.
- Sea surface temperatures: warmer ocean water can provide more energy for tropical cyclone development, if other conditions also cooperate.
- Vertical wind shear: stronger shear can disrupt the vertical organization storms need to develop and intensify.
- Trade winds: changes in the low-level wind pattern can affect ocean temperatures, moisture transport, and the early disturbances that may become storms.
- ACE: accumulated cyclone energy summarizes seasonal storm activity by accounting for storm strength and duration, not just storm count.
A short-answer response should not read, “El Niño happened, so hurricanes decreased.” That skips the mechanism and overstates the certainty. A stronger version would be: “Forecasters lowered Atlantic activity expectations because rising confidence in El Niño suggested more vertical wind shear, which can inhibit tropical cyclone formation and intensification; however, the outlook remains probabilistic because other drivers, including sea surface temperatures, also influence the season.” That answer is not longer because it is wordier. It is longer because it actually explains something.
How Seasonal Forecasts Are Built
NOAA describes hurricane forecasting as work that operates across time scales: broad seasonal outlooks, shorter-range forecasts for active storms, and specialized forecasts for track, intensity, storm surge, rainfall, and hazards.[4] HurricaneScience.org makes a similar distinction between seasonal forecasts and the forecasts issued once individual storms exist.[5] For a seasonal-outlook question, stay with the seasonal layer. It is about the background environment, not the six-hour wobble of a named storm.
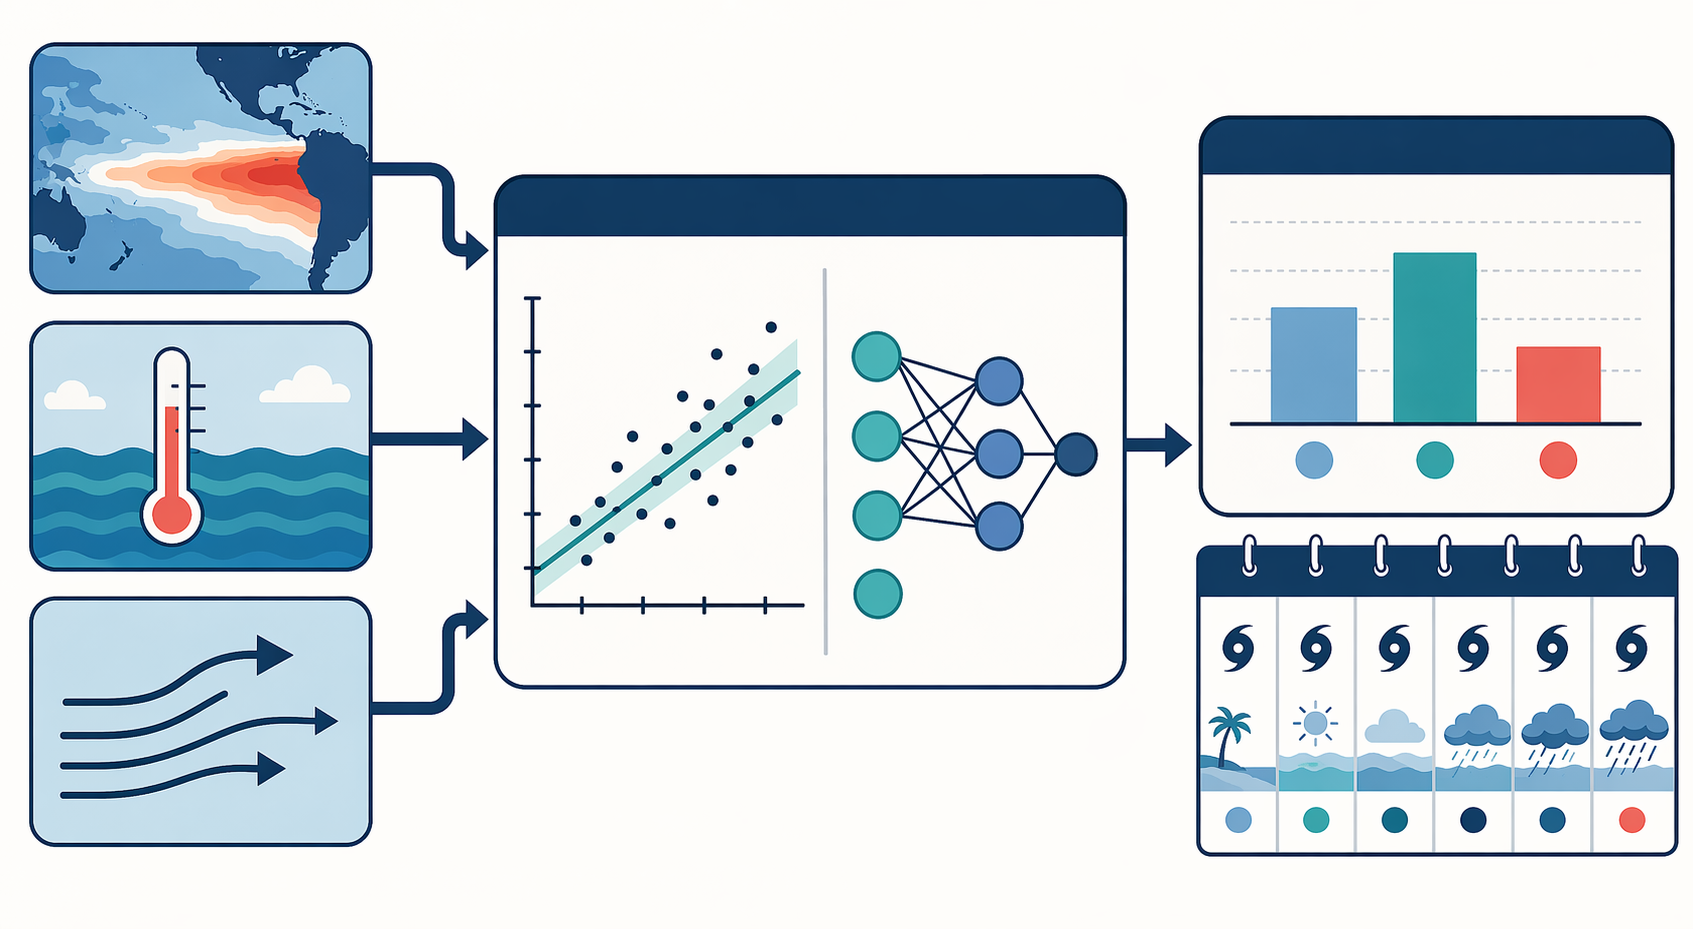
The seasonal workflow is easier to understand if you do not imagine a single model spitting out the answer. Forecasters examine climate drivers, compare present conditions with past seasons, run or consult statistical models, use dynamical climate models, and then translate the combined evidence into public forecast language. The judgment comes in the weighting: how much confidence to put in an emerging El Niño signal, how much warm Atlantic water offsets shear, how consistent the models are, and how wide the final range should be.
CSU’s 2026 process also included a newer tool: the first use of its ACE2 machine-learning model alongside its traditional statistical regression approach.[2] That is worth noting, but not worshiping. Machine learning can detect patterns in large datasets, and it may become useful as part of the forecast toolkit. It does not erase the need to understand the physical drivers, nor does it turn a seasonal outlook into a certainty machine.
| Part of the workflow | What forecasters are trying to learn | Common student mistake |
|---|---|---|
| Climate-driver analysis | Whether ENSO, ocean temperatures, wind shear, and winds favor or suppress activity. | Naming the driver without explaining the mechanism. |
| Statistical modeling | How current patterns compare with relationships observed in past seasons. | Treating past relationships as guarantees. |
| Dynamical modeling | How physics-based models simulate the evolving atmosphere-ocean system. | Assuming one model run is the forecast. |
| Machine-learning tools | Whether pattern-detection methods add useful guidance beside established approaches. | Calling the newest method automatically better. |
| Public outlook language | How to communicate likely ranges and probabilities without hiding uncertainty. | Copying the storm count and ignoring the probability category. |
Notice that the public forecast is the last translation step, not the whole science. By the time a student sees “8–14 named storms,” a chain of observations, assumptions, model comparisons, and expert judgment has already been compressed into a line short enough for a news release.
El Niño Does Not Mean the Same Thing in Every Basin
Here is where many otherwise tidy answers go wrong: students learn that El Niño suppresses Atlantic hurricanes and then apply that sentence everywhere. The 2026 outlooks give a useful correction. NOAA’s Central Pacific outlook called for a 70% chance of an above-normal hurricane season there, even while El Niño was part of the explanation for reduced Atlantic expectations.[6]
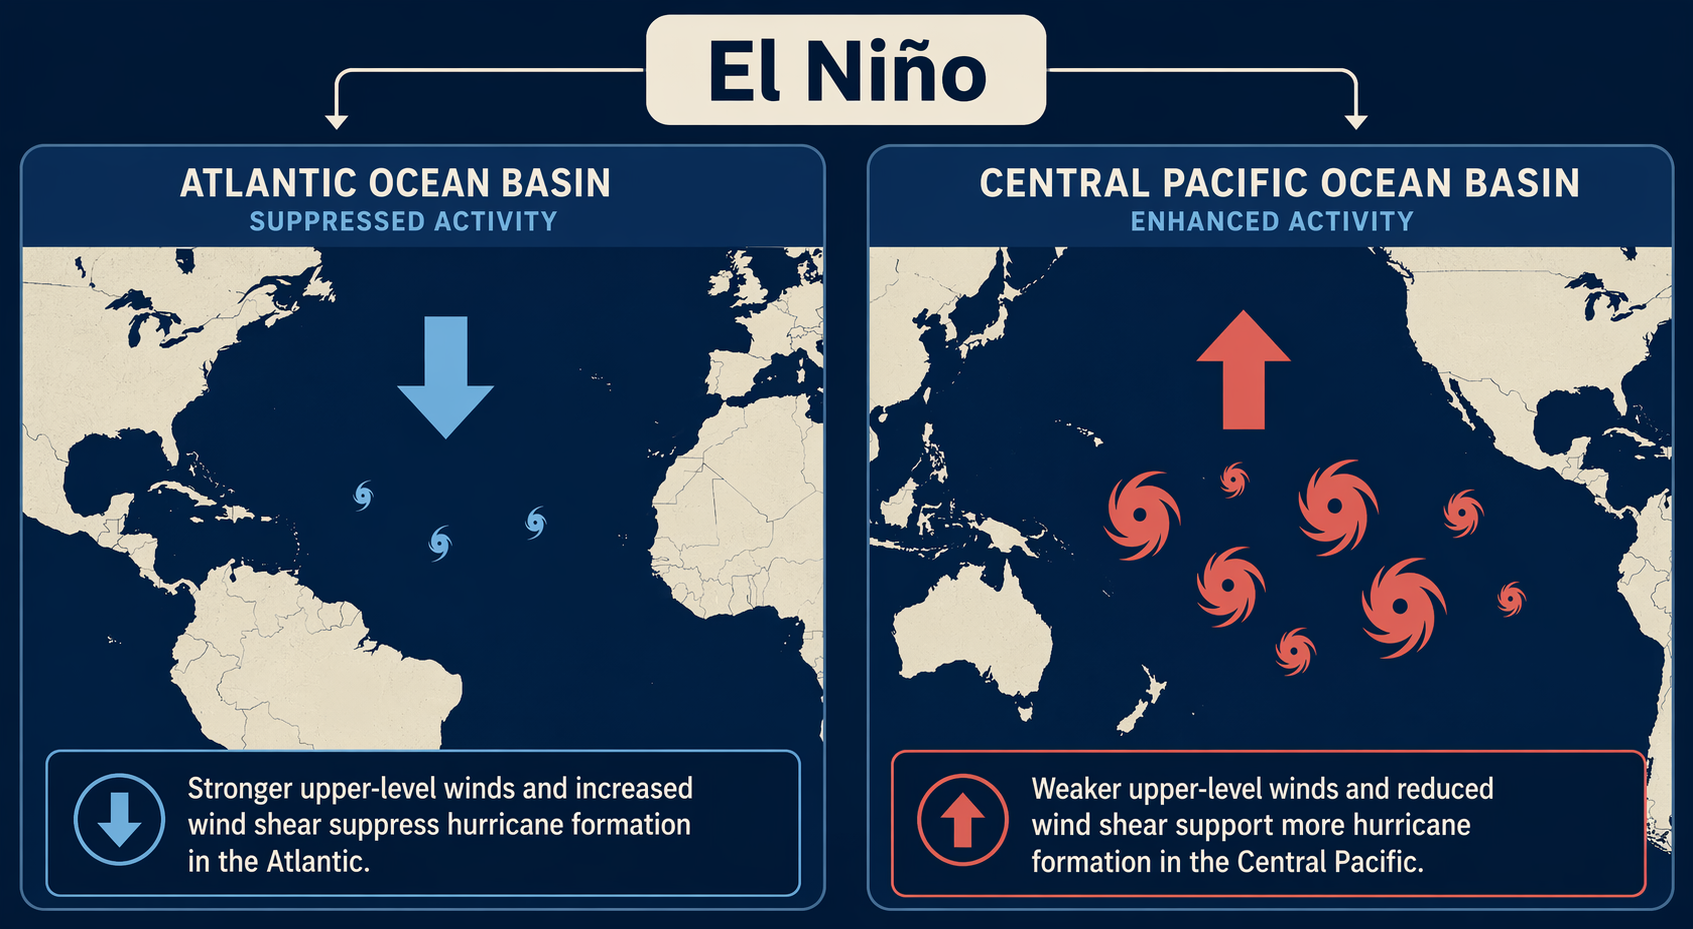
That contrast is not a contradiction. A climate pattern can alter wind shear, ocean temperatures, and atmospheric circulation differently in different regions. In the Atlantic, El Niño is commonly associated with conditions that suppress tropical cyclone activity. In the Central Pacific, the same broad ENSO phase can be associated with a more favorable setup. Same climate driver, different basin response.
For an exam, “basin-specific” is not a decorative phrase. It protects you from overgeneralizing. If the question asks about the Atlantic, answer for the Atlantic. If it asks why El Niño can produce different outlooks in different ocean basins, compare the mechanisms rather than repeating one memorized rule.
Storm Counts Are Only One Measure of a Season
A season with 9 named storms is not automatically “less important” than a season with 14. Counts are easy to copy, which is why they are easy to overuse. Seasonal activity also depends on how strong storms become, how long they last, and whether they affect land. ACE is one attempt to summarize storm strength and duration across a season, but even ACE is still a basin-wide activity measure, not a local impact forecast.
The Saffir-Simpson Hurricane Wind Scale is also narrower than many students assume. UCAR describes hurricane categories by wind speed, with Category 3 or higher considered major hurricanes.[3] That helps interpret the “major hurricane” part of an outlook, but it does not capture every hazard. Rainfall, storm surge, and inland flooding can make a storm dangerous even when a student’s attention is stuck on category labels.
Climate context can add another layer, but it should not be used as a shortcut for a specific seasonal forecast. Climate Central’s 2026 hurricane resources discuss climate-related context for hurricane season, including the relevance of unusually warm ocean water.[7] That background helps explain why ocean heat matters, but the 2026 Atlantic outlook still has to be read through the full mix of seasonal drivers, including El Niño and wind shear.
How to Turn an Outlook Into an Exam Answer
If you are given a seasonal forecast on a test, do not start by reciting every number. Start by identifying the type of forecast. Is it seasonal or short-term? Basin-wide or local? Probabilistic or deterministic? Updated or original? The NOAA and CSU examples become much easier once those labels are in place.
- Name the forecast product: NOAA’s 2026 Atlantic outlook is a probabilistic seasonal basin forecast; CSU’s July 2026 forecast is an updated seasonal forecast.
- State the main evidence: El Niño confidence increased, which matters because El Niño can increase Atlantic vertical wind shear.
- Explain the mechanism: stronger wind shear can disrupt the vertical structure needed for tropical cyclones to form or strengthen.
- Include competing or supporting signals: sea surface temperatures, trade winds, and other atmospheric conditions can also push the forecast.
- Respect the uncertainty: NOAA used ranges and probabilities, and CSU revised its forecast as confidence changed.
- State the limitation: the outlook does not predict landfall, local impacts, or the final storm count while the season is still underway.
A compact answer might look like this: NOAA’s 2026 forecast favored a below-normal Atlantic season but expressed that judgment probabilistically, while CSU lowered its named-storm forecast after confidence in El Niño increased. The forecasts differ because centers can weight signals and communicate uncertainty differently. El Niño can suppress Atlantic activity by increasing vertical wind shear, but sea surface temperatures and other circulation patterns also matter. Neither outlook predicts where storms will make landfall, and because the 2026 Atlantic hurricane season continues through November 30, the final observed activity is not yet known.
That is the level of answer worth aiming for. It explains why NOAA and CSU differ, why CSU changed its forecast, what the probabilities mean, and what the forecast cannot tell us while the season is still in progress.
References
- NOAA predicts below-normal 2026 Atlantic hurricane season, NOAA
- Researchers predicting somewhat below-average Atlantic hurricane season for 2026, Colorado State University
- Hurricanes, UCAR Center for Science Education
- Hurricane forecasting, NOAA
- Forecasting Process, HurricaneScience.org
- 2026 Central Pacific Hurricane Season Outlook, NOAA/National Weather Service
- Hurricane Season, Climate Central
Comments
Join the discussion with an anonymous comment.