

How to Evaluate Wind Turbine Bird Mortality Research
Learn how to critically evaluate scientific research on wind turbine bird mortality by examining sample size, bias correction, and metric selection. This guide uses conflicting studies to build a transferable framework for assessing study credibility in any field.
Updated:
A student reading wind turbine bird mortality research usually meets the puzzle before the method. One source says U.S. wind turbines kill roughly 140,000 birds per year; another pushes the estimate above 1 million. The tempting response is to ask which number is “true.” A better first question is more useful: what changed in the study design to make the number change?
That question matters because the disagreement is not random noise. In this literature, large differences often trace back to visible choices: how many wind farms were sampled, how searchers looked for carcasses, whether the authors corrected for scavengers and missed evidence, which denominator they used, and how far they generalized beyond their field sites. A big number without those attachments is not yet evidence; it is a result waiting for its method.
Start Where The Data Came From
Before judging a wind turbine bird mortality research study, locate its evidence. Did the authors observe one wind farm, a handful of facilities, or a broad sample across regions? Were the sites selected because they were convenient, because they were suspected problem sites, or because they represented a defined population of turbines?
This is not a fussy statistical prelude. A 2009 assessment by Benjamin Sovacool, discussed by the LSE Grantham Research Institute, found that 80% of 616 wind-bird studies examined only one or two wind farms.[1] That finding is a gift for teaching sample size because the problem is easy to see. A carefully searched site can tell us something real about that site. It cannot automatically carry a national estimate on its back.
A small study may still be valuable. It may document a local hazard, test a search protocol, or reveal a species-specific risk. The mistake is not reading it; the mistake is letting its conclusion silently expand from “at this place, under these conditions” to “this is what wind turbines do everywhere.”
Raw Carcass Counts Are The Beginning, Not The Estimate
The most concrete way to understand this field is to imagine the field crew. Someone walks a transect under or near turbines, scans the ground, records carcasses, and returns later. The number in the notebook is not the number of birds that died. It is the number of carcasses found under a particular search schedule, by particular observers, in a landscape where scavengers are also working.
Two biases matter immediately. Persistence bias appears when a carcass disappears before the searcher arrives, often because a scavenger removed it. Detection bias appears when the carcass is present but the searcher misses it. Studies that correct for those two problems can produce mortality estimates two to five times higher than raw carcass counts, according to summaries from the MIT Climate Portal and the LSE Grantham Research Institute.[2][1]
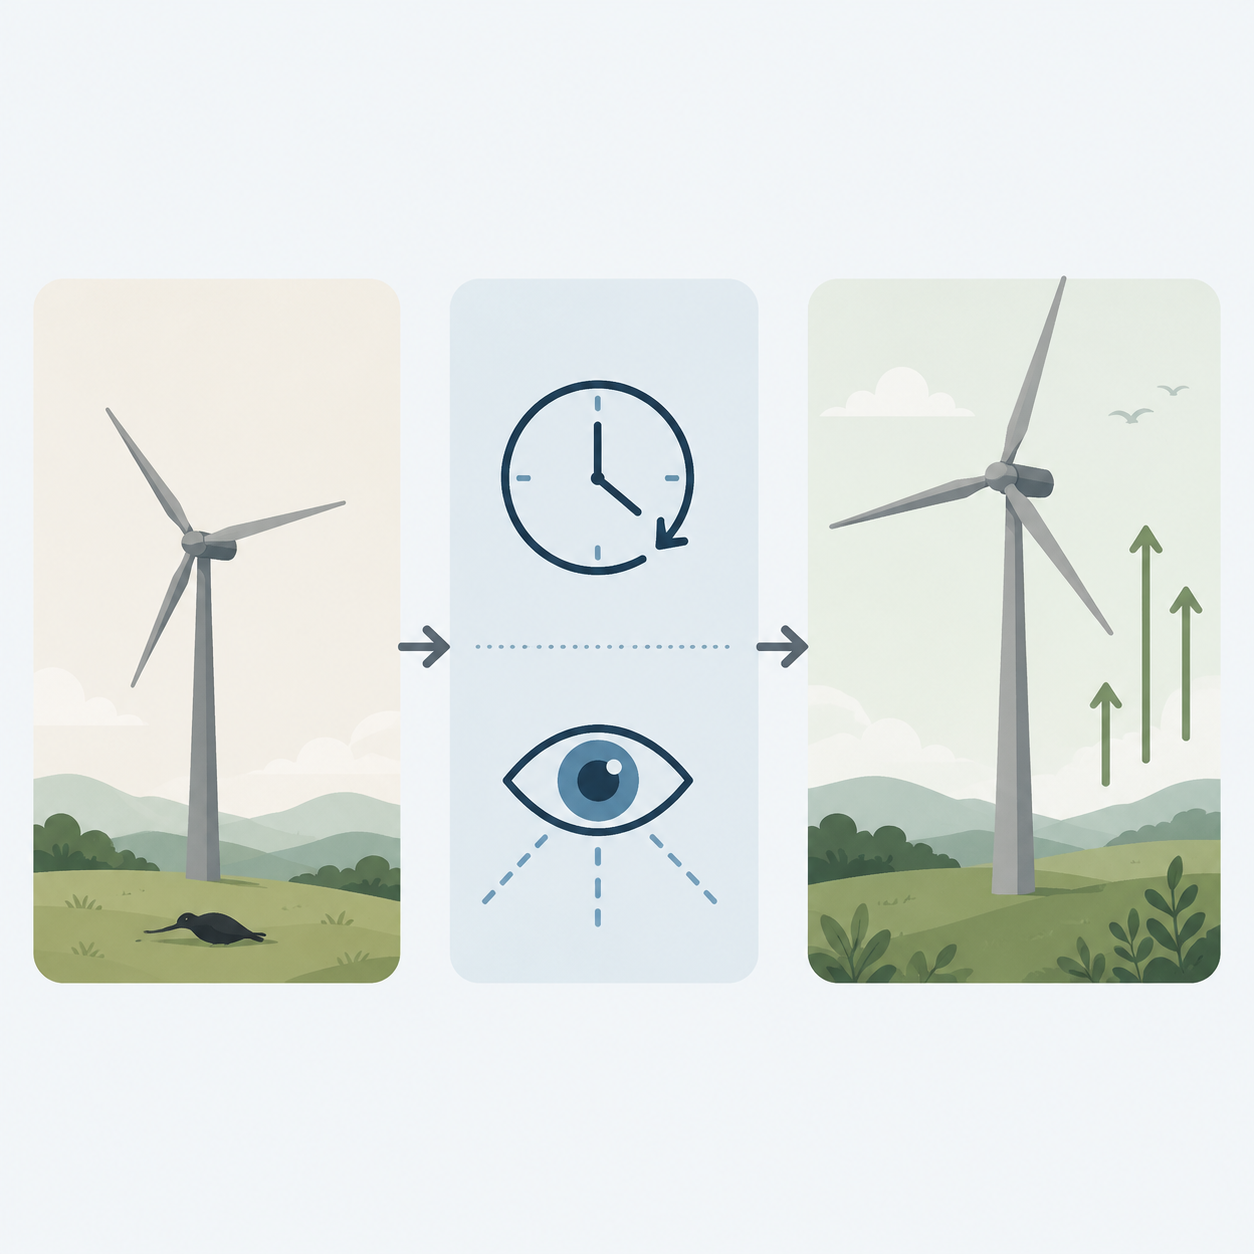
The correction is not an optional polish added after the “real” result. It is part of the measurement. If a study finds 10 carcasses, but persistence and detection trials show that only about half of comparable deaths would likely be found, the study is not inflating the evidence by estimating 20 deaths. It is using evidence about the search process to estimate what the search process missed.
The species involved can change the correction sharply. MIT’s discussion of persistence experiments reports that raptor carcasses had a 71% probability of persisting for 30 days, while small songbird carcasses had only a 4% probability over the same period.[2] A search conducted every few weeks is therefore much more likely to find the raptor than the small bird. Without correction, the field record can make raptors look overrepresented and small birds look scarce, even if the true mortality pattern is different.
Detection has the same practical feel. Human searchers can miss 50% to 80% of small-bird carcasses, and detection dogs can improve recovery, though they are not commonly used in standard monitoring.[2] A paper that used human-only searches is not useless. But its number should be read as the output of that method, not as a direct census of all deaths.
What To Look For In The Methods Section
- Search interval: how many days passed between carcass searches?
- Search area: how far from each turbine did observers look, and was the full area searchable?
- Searcher type: were searches done by humans, dogs, cameras, or a combination?
- Persistence trials: did the authors test how long carcasses remained before removal?
- Detection trials: did the authors test how often searchers found carcasses that were actually present?
- Correction model: did the study clearly explain how raw counts became adjusted mortality estimates?
A Worked Example From The Thar Desert
The Thar Desert study, published in Scientific Reports in 2025, is useful because it makes the correction problem concrete rather than theoretical. The researchers estimated bias-adjusted bird mortality at about 14.9 birds per turbine per year, a rate described as near the upper global limit.[3] A raw-count-only version of the same monitoring would have produced a much lower-looking result.
That difference is the lesson. The corrected estimate does not mean the authors discovered extra birds after the fact. It means they treated the search itself as an imperfect instrument. If carcasses disappear, if small bodies are hard to spot, and if some ground cannot be searched well, then the observed count is a filtered signal. The correction tries to estimate the filter.
The Thar Desert result should not be pulled out of its habitat and pasted onto every wind farm. The rate reflects a specific landscape, species community, turbine context, and monitoring design. Its value for a reader learning methods is not that it supplies the universal number. Its value is that it shows why two studies at the same site can appear to disagree if one reports raw counts and another reports bias-adjusted mortality.
| Question | Why It Changes The Number |
|---|---|
| Were carcasses removed before searchers arrived? | Mortality is underestimated when scavenger removal is not corrected. |
| Could searchers actually see small carcasses? | Small-bird mortality is underestimated when detection failure is ignored. |
| Were different species equally likely to persist? | Species composition can be distorted when large carcasses remain longer than small ones. |
| Was the final number raw or adjusted? | Raw counts and adjusted estimates answer different measurement questions. |
The Denominator Decides What The Number Means
After the numerator comes the denominator. A study may report birds per turbine per year, birds per unit of electricity, or birds per area. These are not interchangeable labels. They answer different questions, and choosing one can make the same phenomenon look local, technological, or system-wide.

Birds per turbine per year is intuitive. Hannah Ritchie’s synthesis discusses studies reporting roughly 4 to 18 birds per turbine per year.[4] That metric is useful for site managers because it maps onto the object they operate: the turbine. If a wind farm adds turbines, changes turbine layout, or tests a mitigation measure on some turbines but not others, this denominator is easy to interpret.
Birds per gigawatt-hour asks a different question: how much bird mortality is associated with a unit of electricity generation? Ritchie reports a comparison of 0.27 birds per GWh for wind and 5.18 birds per GWh for fossil fuels.[4] That number is not a field-site mortality estimate. It is an energy-system comparison, and it becomes relevant when the reader is comparing electricity sources rather than diagnosing a particular wind farm.
Birds per area shifts attention again. The Thar Desert study reported an area-based figure of 4,470 birds per 1,000 km².[4] That denominator can matter when landscape-level conservation questions are being asked, but it will not tell a turbine operator the same thing as birds per turbine per year.
| Metric | Best Question | Common Misread |
|---|---|---|
| Birds/turbine/year | How much mortality is associated with each turbine at a site? | Treating a local turbine rate as a national total. |
| Birds/GWh | How does mortality compare across electricity sources? | Using an energy-system metric to dismiss local conservation risk. |
| Birds/area | How intense is mortality across a landscape? | Assuming area-based density says which turbine or behavior caused the deaths. |
This is also where comparisons to cats, buildings, vehicles, and fossil fuels belong. They can be legitimate comparisons, but only after the comparison frame is named. The LSE Grantham Research Institute summarizes broader context in which cats and buildings kill birds at much larger scales than wind turbines, and vehicles are associated with roughly 200 million bird deaths.[1] That does not erase a local wind-farm problem. It changes the policy question from “does this kill birds?” to “relative to what, measured how, and for which decision?”
When A Mitigation Result Travels Badly
Mitigation studies create the same evaluation problem in a different costume. A result can be real in one setting and weak in another because the setting is part of the treatment.
The black-blade example is memorable for that reason. At Smøla in Norway, painting one turbine blade black was associated with a reduction in bird collisions of more than 70%.[5] That is the kind of result people understandably want to export. But an experiment at Eemshaven in the Netherlands did not find a large reduction.[6]
The contradiction softens once the setting is restored. A snowy island landscape, an industrial port, different bird communities, different flight behavior, and different visual backgrounds do not form the same test. The practical lesson is not that black blades work or fail everywhere. It is that mitigation evidence must be read with the same questions used for mortality evidence: where was it tested, on which species, under what baseline risk, and with what outcome measure?
Generalization Is A Claim, Not A Default
Once a paper has a corrected estimate and a denominator, the next question is scope. Does the study support a claim about one facility, one region, one turbine design, one bird group, or a national fleet? Many weak arguments do not misuse the arithmetic. They misuse the boundary around the arithmetic.
A study of resident raptors near onshore turbines should not be used as though it measured offshore migratory birds. A study of offshore migration should not be used as though it settled local raptor risk in a desert or grassland. A high-risk site can be genuinely high risk without representing all wind energy. A low-collision site can be genuinely low risk without proving that collision risk is negligible everywhere.
This is why a wide national range, such as roughly 140,000 to more than 1 million U.S. bird deaths per year, should not be treated as an embarrassment by itself.[1][4] Ecological estimates often have uncertainty because the underlying events are dispersed, partly unobserved, and unevenly sampled. The useful reading move is to ask which parts of the range come from site coverage, search protocol, correction factors, turbine counts, and extrapolation.
New Tracking Tools Do Not Remove The Need For Scope
The newest studies make the framework more important, not less. An April 2026 Euronews report described two offshore studies using advanced monitoring: a Vattenfall/Spoor AI-video study that tracked 2,007 bird flight paths and recorded zero collisions, and a BWO Germany study that tracked 4 million bird movements over 1.5 years with radar and AI stereo cameras, reporting a 99.8% avoidance rate.[7]
Those are impressive methods as described. They also arrive, for a student reader, through a news summary rather than through independently checked primary papers in the materials available here. That does not make them irrelevant. It places them in an evidence hierarchy: promising, specific, and worth following, but not yet the same kind of source as a peer-reviewed paper whose sampling, model, and uncertainty intervals can be inspected directly.
Their scope is also narrow in a useful way. Offshore migratory-bird tracking is not the same question as onshore raptor mortality. Near-zero or very low collision findings in one monitored offshore context do not contradict studies finding risk elsewhere; they may simply be measuring different birds, different behavior, different turbine settings, and different landscapes.
A Reusable Reading Checklist
When a scientific paper gives a large mortality number, resist accepting or rejecting it at the headline level. Read the number as the final line of a chain. The chain is what you evaluate.
- Define the claim: is the paper estimating deaths at one site, across a region, nationally, or per unit of energy?
- Check the sample: how many wind farms, turbines, seasons, and species groups actually produced the data?
- Inspect the search protocol: who searched, how often, across what area, and with what limitations?
- Look for bias correction: did the authors correct for scavenger removal and missed carcasses?
- Name the denominator: is the result per turbine, per year, per GWh, per area, or a total?
- Separate adoption from effectiveness: did a mitigation method merely get used, or did the study measure a collision reduction?
- Limit the generalization: which landscapes, species, turbine types, and time periods does the evidence actually cover?
- Rank the source: are you reading a peer-reviewed paper, a report, a vendor disclosure, or a news summary of unpublished work?
Wind turbine bird mortality research is useful for learning research evaluation because the methodological switches are visible. Change the number of sites, and generalizability changes. Change the search interval, and small carcasses disappear. Add persistence and detection correction, and raw counts become higher mortality estimates. Change the denominator, and the same deaths answer a different question. The range of published estimates becomes less mysterious once the reader stops asking only what the number is and starts asking how the study made it.
References
- Behind the headlines: bird fatalities and wind turbines, LSE Grantham Research Institute
- Do wind turbines kill birds?, MIT Climate Portal
- Thar Desert study, Nature Scientific Reports, 2025
- Wind power bird deaths, Sustainability by Numbers
- Wind Turbines Threaten Birds. Could the Solution Be a Smarter Blade?, Yale E360
- A Surprisingly Simple Solution to Protect Birds From Wind Turbines Gets Its Biggest Test Yet, Audubon
- Two new studies could change critics' opinions about how many birds die from wind turbines, Euronews, April 11, 2026
Comments
Join the discussion with an anonymous comment.