
ASVAB Exam Hub
California Earthquake Fault Lines Study Guide
An organized review of what earth science tests actually ask about California's earthquake fault lines: the three fault types tied to stress, San Andreas system numbers, named-fault slip rates and 30-year probability forecasts, anchor historical quakes, and the focus/epicenter and seismic-wave vocabulary. Key figures carry USGS, Caltech, or UC Berkeley source labels so you can memorize with confidence.
- gre
- mcat
- asvab
- sat
- act
- digital-adaptive
- official-material
- section-strategy
- test-date-timeline
A good california earthquake fault lines study guide for earth science does not need to retell all of California geology. It needs to protect you from the small mistakes that cost points: calling the San Andreas “left-lateral,” treating a 30-year forecast as a prediction, mixing up epicenter and focus, or memorizing a probability without knowing whether it applies to one fault or a whole region.
Use this guide as a test-ready memory set. If you are studying for a high school earth science quiz, an early-college geology exam, or the General Science section of the ASVAB exam hub, drill the facts below first. If your teacher asks for deeper transform-boundary mechanics, use the ASVAB San Andreas Fault guide or the broader earthquake science and San Andreas guide for the conceptual background. This page is narrower: the named faults, numbers, historical anchors, and vocabulary most likely to appear in test questions.
- Fault types: normal faults go with extension, reverse or thrust faults go with compression, and strike-slip faults go with shear.
- California example to recognize fast: the San Andreas Fault is a right-lateral strike-slip transform boundary between the Pacific Plate and the North American Plate.
- Named-fault memory set: San Andreas, Hayward, San Jacinto, Calaveras, Elsinore, and Newport-Inglewood.
- Forecast language: UCERF-style numbers are 30-year earthquake forecasts, not predictions of a specific date, rupture, or epicenter.
- Historical anchors: 1857 Fort Tejon, 1868 Hayward, 1906 San Francisco, 1989 Loma Prieta, and 1994 Northridge.
- Measurement vocabulary: focus or hypocenter versus epicenter, P waves before S waves, P–S gap for distance, three or more stations for triangulation, and magnitude versus Modified Mercalli intensity.
First sort the fault by stress, not by location
Many exam questions start with a diagram, not a California map. Your first job is to identify the stress regime. The USGS defines a fault as a fracture along which blocks of crust have moved, then separates the basic fault motions by how those blocks move relative to each other: normal, reverse, and strike-slip.[1] IRIS teaches the same three-way pattern as three basic responses to stress: extension, compression, and shear.[2]
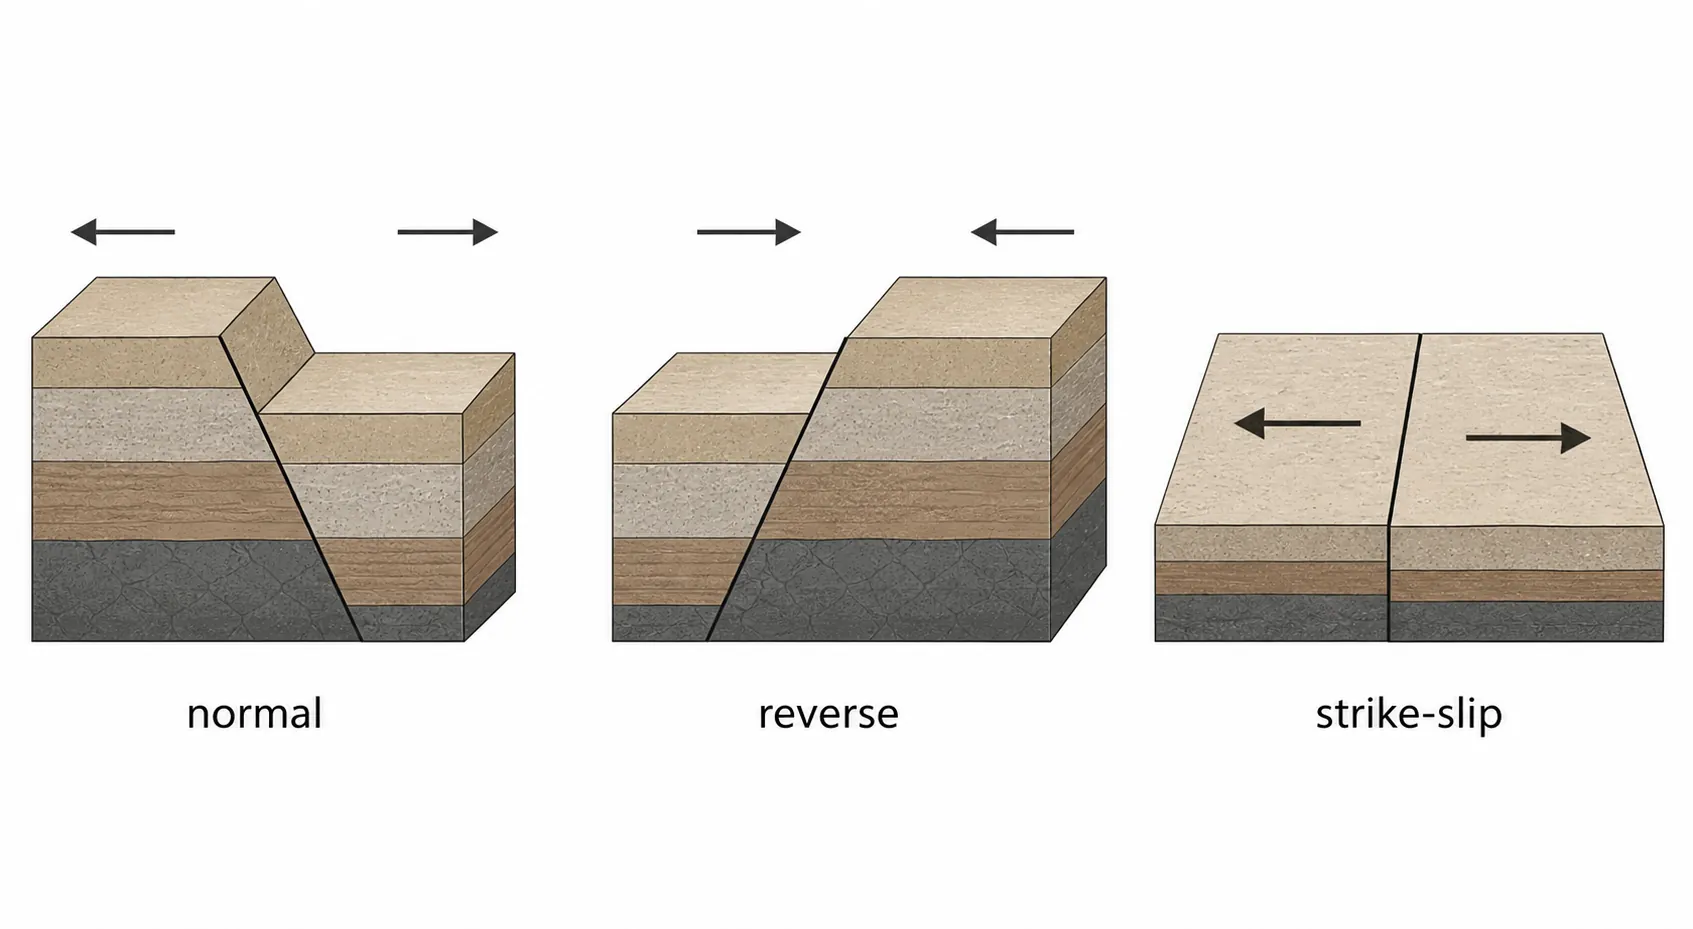
| Fault type | Stress regime | Motion to recognize on a diagram | California exam connection |
|---|---|---|---|
| Normal fault | Extension | Crust is pulled apart; hanging wall moves down relative to footwall. | Useful for general fault-type questions, but not the main San Andreas example.[1][2] |
| Reverse or thrust fault | Compression | Crust is squeezed; hanging wall moves up relative to footwall. A thrust fault is a low-angle reverse fault. | Important for the 1994 Northridge anchor because that quake occurred on a blind thrust fault. |
| Strike-slip fault | Shear | Blocks slide horizontally past each other. | The San Andreas is the classic California example: a right-lateral strike-slip transform fault.[1][2] |
The wording “right-lateral” is not decorative. If you stand on one side of a strike-slip fault and the opposite side appears to move to your right, the fault is right-lateral. That is the label used for the San Andreas, and it is one of the easiest points to lose if you answer from memory too quickly.
San Andreas facts to memorize before you add the other faults
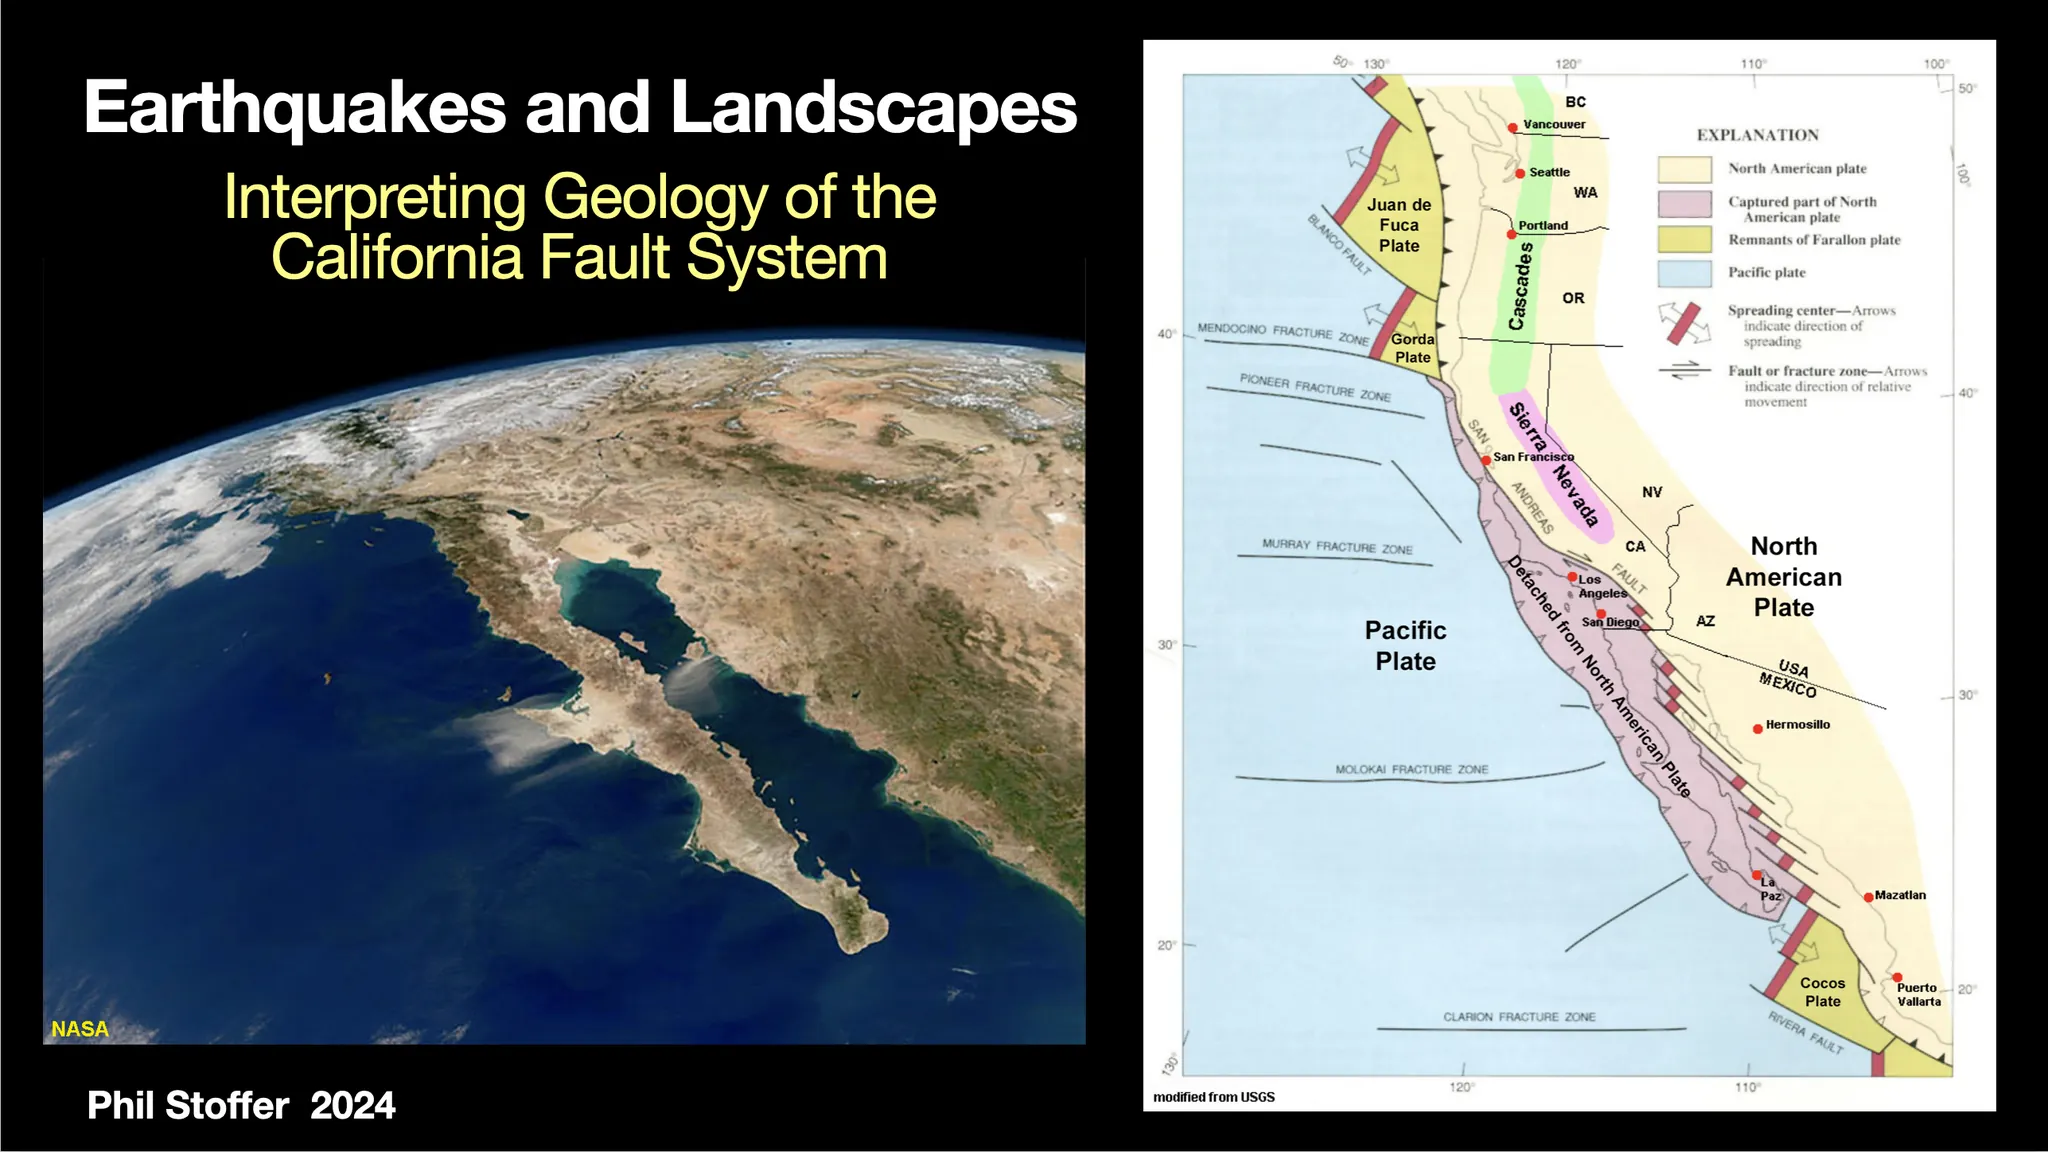
For most earth science tests, the San Andreas is the master example: a right-lateral strike-slip fault system forming the transform boundary between the Pacific Plate and the North American Plate. USGS teaching materials describe the system as more than 800 miles long and at least 10 miles deep, with average slip along the fault of about 20 to 35 millimeters per year.[3] Britannica gives a closely related plate-motion figure of about 33 to 37 millimeters per year across the plate boundary system, which is why you may see slightly different numbers depending on whether the source is describing fault slip or total relative plate motion.[4]
| San Andreas fact | Memorize it this way | Why it matters on a test |
|---|---|---|
| Fault type | Right-lateral strike-slip transform fault | Connects the named California fault to shear stress and horizontal motion.[3] |
| Plate boundary | Pacific Plate moving past the North American Plate | Turns a local California fault question into a plate-tectonics question.[3] |
| System length | More than 800 miles | Useful when a question asks why the San Andreas is a fault system, not a single short crack.[3] |
| Depth | At least 10 miles deep | Keeps the fault from being treated as only a surface line on a map.[3] |
| Slip or motion figure | About 20–35 mm/yr average slip on the fault; about 33–37 mm/yr relative plate motion across the system | These numbers are close but not identical because they describe different measurements.[3][4] |
That last row is the one to label carefully in notes. If a teacher gives one number from USGS and another from a textbook, the conflict may not be a mistake. One number may describe slip on the San Andreas itself; another may describe the broader plate-boundary motion distributed across multiple faults.
Named California faults: the study table
Do not memorize California faults as a random list of scary names. Attach each one to the fact that gives it test value: a motion type, a slip figure, a historical event, or a forecast category. Also keep regional forecasts separate from single-fault forecasts. The Bay Area forecast is not “the Hayward forecast,” even though the Hayward number is one of the most important pieces inside it.
| Fault or forecast item | Exam-ready cue | Number or anchor to memorize | Source note |
|---|---|---|---|
| San Andreas Fault system | Classic right-lateral strike-slip transform boundary | >800 miles long; at least 10 miles deep; about 20–35 mm/yr average slip | Use USGS for the fault-system numbers.[3] |
| Hayward Fault | Major Bay Area strike-slip fault; often tested with the 1868 quake and Bay Area forecast | Creep is about 0.2 inch per year; 1868 quake is listed as M6.8; the last five major quakes averaged about 138 years apart; 33% chance of one or more M6.7+ earthquakes on the Hayward-Rodgers Creek system before 2043 | UC Berkeley labels the creep and history; the 33% forecast appears in USGS Bay Area forecast materials.[5][6][7] |
| San Jacinto Fault Zone | Major southern California strike-slip fault zone; often described as one of the most seismically active zones in southern California | Working study figure: about 14 mm/yr slip rate | Treat this as a working study figure until you verify it against current USGS event-page or fault-database material. |
| Calaveras Fault | Bay Area fault related to the broader San Andreas system | Working study figure: about 6 mm/yr slip rate | Treat this as a working study figure until you verify it against current USGS event-page or fault-database material. |
| Elsinore Fault Zone | Large southern California fault zone that is commonly described as historically quiet compared with its size | Anchor event often attached in study notes: 1892 M7 earthquake | Use as a recognition cue, then confirm the magnitude scale in your course source. |
| Newport-Inglewood Fault | Los Angeles Basin fault; useful because it connects fault study to an urban historical earthquake | Anchor event: 1933 Long Beach earthquake, commonly listed as M6.4 | Use as a named-fault/event pair; confirm the magnitude scale if your course distinguishes local, surface-wave, and moment magnitude. |
| Bay Area 30-year forecast | Regional forecast, not one fault’s guaranteed behavior | 72% chance of at least one M6.7+ earthquake in the San Francisco Bay region before 2043 | USGS Fact Sheet 2016-3020; this is a 30-year forecast, not a prediction.[7] |
| Statewide California 30-year forecast | UCERF3-style statewide probability | >99% chance of one or more M6.7+ earthquakes in California in 30 years; about 7% chance of an M8+ earthquake in 30 years | USGS UCERF3 fact sheet; SCEC also summarizes UCERF probabilities. These are forecasts, not predictions.[8][9] |
The Hayward row deserves extra attention because it is easy to overstate. UC Berkeley’s Hayward Fault materials describe the fault as creeping at about 0.2 inch per year and identify the 1868 earthquake as the major historical event tied to the fault.[5][6] The 33% number belongs to the Hayward-Rodgers Creek system in the Bay Area forecast window before 2043; it does not mean there is a 33% chance of a named earthquake on a named date.[7]
That wording also matters for newer stress-model research. A 2026 report on southern California’s “earthquake gate” discussed modeled stress of about 3.6 MPa on the San Jacinto-Bernardino section, but the work is still a physics-based model, not a prediction of a specific earthquake.[10][11] On an exam, “forecast,” “probability,” “stress model,” and “prediction” are not interchangeable.
Historical earthquake anchors California tests keep recycling
You do not need a disaster-history essay for each earthquake. You need an anchor: date, approximate magnitude, fault or fault type, rupture fact when it is famous, and the reason it stays in textbooks.
| Earthquake | Magnitude and rupture facts | Why it matters for a fault-lines test |
|---|---|---|
| 1857 Fort Tejon earthquake | M7.9; about 350 km of surface rupture; maximum offset about 9 m at Carrizo Plain | Classic large San Andreas rupture in southern and central California.[12] |
| 1868 Hayward earthquake | M6.8 on the Hayward Fault | Bay Area anchor event; pairs with the Hayward forecast and the idea that damaging Bay Area earthquakes are not only San Andreas events.[6][13] |
| 1906 San Francisco earthquake | Modern sources commonly list about M7.8–7.9; the San Andreas rupture extended for hundreds of kilometers, and USGS materials note very large horizontal offsets such as about 21 feet near Tomales Bay | The standard northern San Andreas historical anchor; also a reminder that magnitude values vary by scale and source.[3][14] |
| 1989 Loma Prieta earthquake | M6.9; 63 deaths | Often tested as the Bay Area earthquake associated with the 1989 World Series era, but it was not a repeat of the 1906 San Francisco rupture.[15] |
| 1994 Northridge earthquake | M6.7 blind thrust earthquake | Prevents the false shortcut that all important California earthquakes are San Andreas strike-slip events.[16] |
Magnitude is the fact most likely to vary across sources. The 1906 San Francisco earthquake is a good example: older teaching materials and modern moment-magnitude summaries may not print the same value. For a test, use the magnitude scale your class source uses, and write “about” when the source itself gives a range or when different accepted scales are being compared.
Forecasts are probabilities, not earthquake appointments
California earthquake forecasts answer a bounded probability question: over a stated time window, what is the chance of at least one earthquake at or above a stated magnitude in a stated area? They do not name the day, hour, exact rupture, or epicenter.
| Statement | Correct wording | Wrong wording to avoid |
|---|---|---|
| Bay Area regional forecast | The San Francisco Bay region has a 72% chance of at least one M6.7+ earthquake before 2043.[7] | The Bay Area will have a M6.7 earthquake in 2043. |
| Hayward-Rodgers Creek forecast | The Hayward-Rodgers Creek system has a 33% chance of one or more M6.7+ earthquakes before 2043.[7] | The Hayward Fault is predicted to rupture next. |
| Statewide UCERF3 forecast | California has a >99% chance of one or more M6.7+ earthquakes in 30 years, and about a 7% chance of an M8+ earthquake in 30 years.[8][9] | USGS predicted the next big California earthquake. |
| Stress-model studies | A stress model may identify loading conditions or possible rupture behavior, but that still is not a date-specific prediction.[10][11] | A model found stress, so it predicted the next quake. |
If a multiple-choice answer says “scientists can predict the exact time and place of California’s next major earthquake,” reject it. Forecasting probability over decades is not the same claim as predicting a specific event.
Measurement vocabulary: the terms that make the map questions work
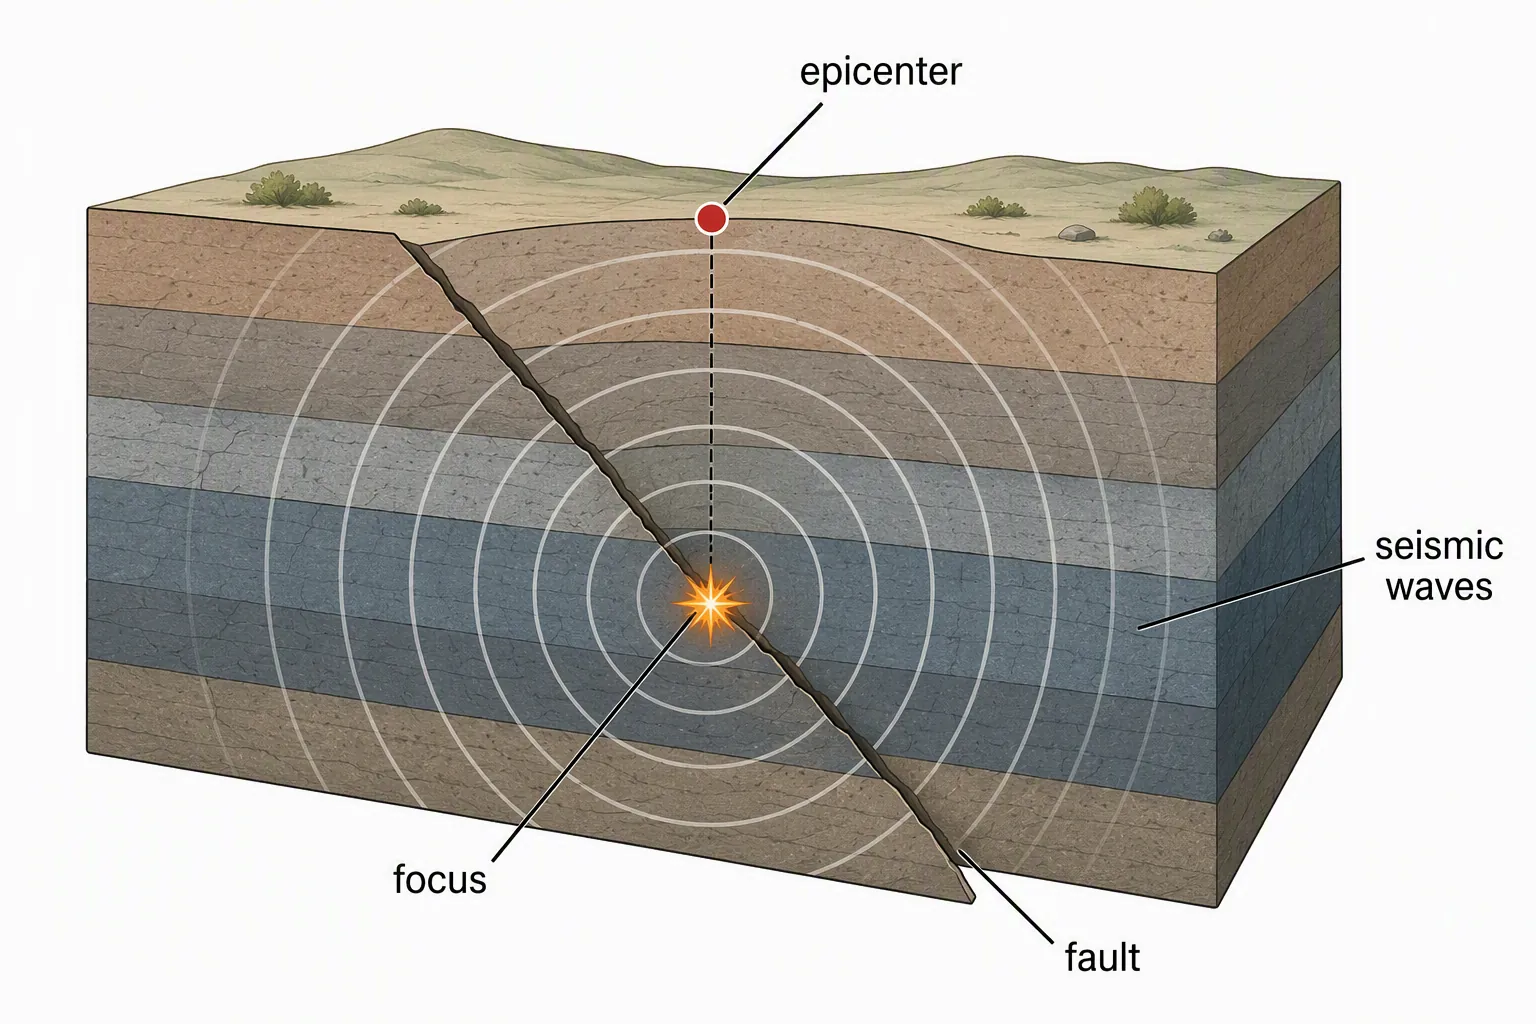
Fault-line questions often slide into earthquake-location vocabulary. The focus, also called the hypocenter, is the point underground where rupture starts. The epicenter is the point on Earth’s surface directly above the focus. USGS teaching material notes that about 75% of earthquake foci occur in the top 10 to 15 kilometers of the crust, which is why many introductory diagrams show shallow crustal earthquakes.[3]
| Term or method | Exam-safe definition | Common trap |
|---|---|---|
| Focus or hypocenter | The underground point where the earthquake rupture begins | Do not place it on the surface unless the diagram specifically labels a surface rupture. |
| Epicenter | The surface point directly above the focus | Do not define it as the place where shaking is always strongest; local ground conditions can change intensity. |
| P waves | Primary waves; they arrive before S waves | Do not reverse the arrival order. |
| S waves | Secondary waves; they arrive after P waves | Do not use S-wave arrival alone to locate the epicenter. |
| P–S arrival gap | The time gap between first P-wave and first S-wave arrivals; it helps estimate distance from the station to the earthquake | A single station gives distance, not a unique epicenter. |
| Triangulation | Three or more seismic stations can be used to locate the epicenter by comparing distances | Two stations usually leave ambiguity; three or more is the standard classroom rule.[17][18] |
Magnitude and intensity are a separate pair. Magnitude estimates the size of the earthquake at its source. It is logarithmic: one magnitude unit corresponds to about 10 times the recorded wave amplitude and roughly 30 times the energy release. Modified Mercalli intensity, by contrast, describes observed shaking and damage at a location on a I–XII scale. USGS teaching material notes that soft ground can raise felt intensity by about 2 to 3 units compared with nearby bedrock.[3]
| If the question asks... | Answer with... |
|---|---|
| How much energy did the earthquake release? | Magnitude |
| How strongly did people and buildings shake at one town? | Modified Mercalli intensity |
| Why can two places experience different shaking from the same earthquake? | Distance, local geology, ground type, and building conditions affect intensity. |
| Why can one earthquake have one magnitude but many intensity values? | Magnitude describes the event; intensity describes local effects. |
A practical drill order for this unit
Start with the facts that unlock the most questions. Do not spend your first study session rereading dramatic earthquake narratives. Build a compact recall sheet, cover one column, and test yourself until the labels come out cleanly.
- Drill the three stress-fault pairs: extension-normal, compression-reverse/thrust, shear-strike-slip.
- Write the San Andreas sentence from memory: right-lateral strike-slip transform boundary between the Pacific and North American plates; more than 800 miles long; at least 10 miles deep; about 20–35 mm/yr average slip.
- Memorize the forecast numbers with their boundaries: Bay Area 72% M6.7+ before 2043; Hayward-Rodgers Creek 33% M6.7+ before 2043; statewide >99% M6.7+ in 30 years; statewide about 7% M8+ in 30 years.
- Attach each historical anchor to one cue: Fort Tejon-large San Andreas rupture, Hayward-1868 Bay Area fault, San Francisco-1906 northern San Andreas, Loma Prieta-1989 Bay Area M6.9, Northridge-1994 blind thrust.
- Practice diagram labels last: focus below, epicenter above, P waves before S waves, P–S gap gives distance, three or more stations locate the epicenter.
Facts that need source labels in your notes are the numerical ones: slip rates, recurrence averages, magnitude values, rupture lengths, death counts, and 30-year probabilities. These can vary by source, scale, or model. Definitions such as focus, epicenter, and strike-slip motion still need to be correct, but they are less likely to vary from one reputable earth science source to another.
If this is part of a wider earth science review, pair this fault-line sheet with the volcano eruption study guide and the El Niño weather exam guide. If the problem is time, not understanding, put the fault table into a midterm study schedule or a 30-day exam countdown planner. California fault-line questions look sprawling, but most of them recycle the same source-labeled facts, definitions, named examples, and probability wording.
References
- What is a fault and what are the different types? — USGS
- Fault Types: 3 Basic responses to stress — IRIS
- The San Andreas Fault — USGS
- San Andreas Fault — Britannica
- Hazards of the Hayward Fault — UC Berkeley Seismological Laboratory
- History of the Hayward Fault — UC Berkeley Seismological Laboratory
- Earthquake Outlook for the San Francisco Bay Region 2014–2043 — USGS, 2016
- UCERF3: A New Earthquake Forecast for California’s Complex Fault System — USGS, 2015
- UCERF — SCEC
- Southern California’s ‘earthquake gate’ shows signs of stress — ScienceDaily, June 17, 2026
- Southern California’s earthquake gate — EarthScope
- Fort Tejon Earthquake, 1857 — Caltech SCEDC
- 1868 Hayward Earthquake — USGS
- 1906 San Francisco Earthquake — USGS
- 1989 Loma Prieta Earthquake — USGS
- 1994 Northridge Earthquake — USGS
- How to Find the Epicenter of an Earthquake — KQED
- Tectonic Forces — Lumen Learning
Related exhibits & inventory
Verified outcomes
No verified outcomes on file for this exam yet
See Methodology for how outcome evidence is disclosed once logged.
Planners
No planner filed for this exam yet
A downloadable timeline template for this exam hasn't been published yet.
Tool verdicts
AI-tool cautions
No AI tools tested for this exam yet
No hands-on AI-accuracy logs have been filed for this exam.
Questions about this plan
Ask a question about a specific section, timeline, or citation in this plan — or flag something that needs correcting.
Comments
Join the discussion with an anonymous comment.