
Wildfire Smoke Air Quality: A Student's Resource Guide
This guide curates the best government, academic, and monitoring resources for studying wildfire smoke and air quality, helping students find authoritative data, health impact studies, and equity analyses for term papers and research projects.
Updated:
Wildfire smoke air quality study resources are easy to collect and surprisingly easy to misuse. A live smoke map, a hospital-admissions study, an EPA preparedness page, and a fire-emissions inventory can all be excellent sources, but they do not answer the same question. If a paper treats them as interchangeable proof, the argument starts looking tidy before it is actually defensible.
The attention-grabbing claim is real enough to take seriously: Stanford physician Lisa Patel described PM2.5 from wildfire smoke as “10 times more toxic” than PM2.5 from fossil fuel combustion in a 2025 Stanford Report article.[1] That is a strong opening hook for a student paper, but it is still expert commentary in a university news story, not a peer-reviewed dose-response estimate. The stronger academic move is to use it to introduce the stakes, then build the evidence base from monitoring systems, systematic reviews, epidemiologic studies, and equity research.
Start by asking what kind of claim you need to support
A good wildfire-smoke paper usually needs more than one source type. The mistake is not using AirNow, PurpleAir-derived sensor data, satellite smoke layers, hospital studies, or model outputs. The mistake is asking one of them to do a job it was not built to do.
| If your claim is... | Use this kind of resource | What it can support | What it should not be asked to prove |
|---|---|---|---|
| Smoke was affecting a place at a specific time | Real-time air quality and smoke maps | Current or recent PM2.5 conditions, monitor and sensor readings, smoke-plume context | Long-term health risk by itself |
| People should reduce exposure during a smoke event | Public-health guidance | Recommended protective actions for households, schools, clinics, or communities | Original evidence of disease burden |
| Wildfire smoke is associated with health outcomes | Peer-reviewed reviews and epidemiologic studies | Respiratory morbidity, selected cardiovascular endpoints, hospitalizations, mortality estimates | Exact conditions at one address during one fire |
| Smoke may move into a region tomorrow | Forecasting and dispersion models | Modeled smoke transport, expected PM2.5 impacts, scenario planning | Observed exposure unless validated against measurements |
| Some communities face greater risk or fewer protections | Equity and vulnerability datasets or field studies | Preparedness gaps, pollution burden, social vulnerability, resource access | A universal statement about all exposed populations |
| A fire contributed emissions to the atmosphere | Fire-emissions inventories | Estimated emissions for atmospheric chemistry, climate, or policy analysis | Individual health outcomes without exposure and health data |
That separation matters because wildfire smoke research is often assembled under deadline pressure. A student sees orange skies, opens a map, finds a health statistic, and wants the pieces to snap together. They can, but only if the paper is honest about what each piece measures.
Use AirNow Fire & Smoke Map for conditions, not for the whole argument
For most student projects, the AirNow Fire & Smoke Map is the cleanest first stop. It combines regulatory monitoring data, low-cost sensor information, and satellite smoke-plume layers into a public interface designed around PM2.5 conditions during fire events.[2] That makes it useful for grounding a paper in a real place and time: where smoke was visible, where monitors were reporting elevated PM2.5, and how conditions differed across nearby communities.
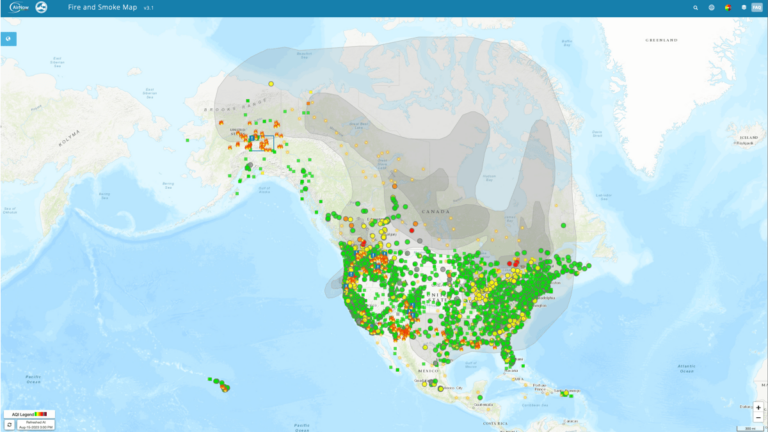
The useful habit is to write down what layer you are using. A permanent regulatory monitor, a corrected low-cost sensor, and a satellite smoke overlay are related evidence, not identical evidence. A monitor reading can support a claim about measured PM2.5 at or near a monitoring site. A sensor network can fill in local variation, especially where monitors are sparse, but it needs attention to correction methods and siting. A smoke-plume layer can show likely smoke presence aloft or near the surface, but it is not the same as a person’s measured inhaled dose.
A defensible sentence sounds like this: “During the event, the AirNow Fire & Smoke Map showed elevated PM2.5 readings from nearby monitoring and sensor locations, with satellite smoke layers indicating regional smoke influence.” That sentence does not pretend to diagnose disease, estimate individual exposure, or prove causation. It does the job a map is good at doing.
A quick source-checking routine for map data
- Record the date, time zone, and location you checked; smoke conditions can change within hours.
- Identify whether you are citing a regulatory monitor, low-cost sensor, satellite plume, or map summary.
- Avoid using a single screenshot as if it were a full exposure assessment.
- Pair map evidence with peer-reviewed health literature if your claim moves from air quality to health effects.
- Be careful with neighborhood comparisons when monitor coverage differs across communities.
Use EPA guidance for what people should do during smoke
Once a paper describes smoke conditions, the next question is often practical: what should people, schools, clinics, or local agencies do? The EPA Smoke-Ready Toolbox is useful here because it organizes preparedness and exposure-reduction materials for wildfires at the community level.[3] It is not the place to prove that smoke causes asthma exacerbations or hospital admissions; it is the place to cite when discussing recommended protective actions and planning.
The EPA’s “Wildfire Smoke and Your Patients’ Health” course is also worth knowing about, especially for public-health, nursing, medicine, and environmental health students. Because some source lists point to an archived 19jan snapshot, verify the live course URL before publication or assignment use.[4] If you cite it, cite it as a training and clinical-communication resource, not as a primary epidemiologic study.
Build the health-effects section from reviews and large studies
The health-effects part of a wildfire smoke paper should not rest on a map. It needs peer-reviewed evidence. Reid and colleagues’ 2016 critical review is one of the most useful anchors because it synthesized 53 studies and found the strongest consistency for respiratory morbidity, including asthma and chronic obstructive pulmonary disease outcomes.[5] Liu and colleagues’ 2015 systematic review is a complementary source for non-occupational physical health impacts from wildfire smoke exposure.[6]
Those reviews are especially helpful because they show where the evidence is stronger and where it is thinner. Respiratory outcomes are the safest center of gravity for a student paper. If your argument is about asthma exacerbation, emergency visits, respiratory symptoms, or smoke-sensitive groups, the review literature gives you a much firmer base than a general statement that “smoke is bad for health.”
Global mortality estimates can help establish scale, but they need dates attached. Johnston and colleagues estimated 339,000 annual premature deaths globally attributable to landscape fire smoke in a study published in 2012.[7] That number is large enough to matter, but the publication date matters too. It should be presented as a major published estimate from that study, not as a current global count for 2026.
Newer work is beginning to stretch the time window beyond same-day or short-lag effects. Wei and colleagues’ 2025 study, reported by the Harvard Gazette, examined more than 13.7 million hospitalizations across 15 states and documented medium-term cardiorespiratory effects lasting up to three months after fire exposure.[8] That is valuable for students because it supports a more realistic question: not only what happens during the smoky week, but what health burdens may continue after the plume is gone.
Handle cardiovascular findings carefully
Cardiovascular evidence is where source discipline really shows. It is tempting to write that wildfire smoke causes cardiovascular disease and move on. The better version is narrower: grouped cardiovascular-disease findings can be null in some analyses, while specific endpoints such as cardiac arrest, myocardial infarction, or hypertension may show significant increases in particular studies or exposure windows. That distinction is not academic fussiness; it changes what the paper is claiming.
If your paper focuses on respiratory outcomes, say so and build deeply there. If it includes cardiovascular outcomes, separate broad grouped categories from specific endpoints, and describe the exposure window. A same-day association, a multi-week lag, and a three-month post-fire effect are not interchangeable.
Forecasts and models answer a different question than monitors
Forecasting tools are most useful when the research question is about movement, planning, or modeled exposure rather than what was measured at a monitor. The Interagency Wildland Fire Air Quality Response Program’s Smoke Outlooks provide daily smoke forecasts prepared by Air Resource Advisors during significant fire events.[9] For a case study, these outlooks can show what information was available to the public and decision-makers at the time.
AirFire’s BlueSky tools belong in a slightly different slot. BlueSky is a smoke-modeling system for estimating emissions, plume rise, transport, and surface smoke impacts.[10] It is useful for atmospheric science, exposure modeling, and policy-analysis projects, especially when a student wants to explain how forecasted smoke concentrations are generated. It should not be described as a direct measurement system unless the project is specifically comparing modeled estimates with observed monitor data.
FINN, the Fire INventory from NCAR, is even farther upstream. It estimates global fire emissions for atmospheric chemistry and modeling work.[11] A student writing about emissions, chemical transport, or climate interactions may need FINN. A student writing about emergency department visits probably does not need to cite an emissions inventory unless the paper explicitly connects emissions estimates to exposure modeling and health outcomes.
Equity sources keep the paper from treating exposure as evenly distributed
Wildfire smoke exposure is atmospheric, but preparedness is social. Palinkas and colleagues’ 2023 study of low-income Los Angeles residents is useful because it makes that difference concrete: only 17.5% of participants checked the AQI daily during smoke events, and only 2 of 40 households owned air filters.[12] That is stronger than a vague sentence about “vulnerable populations” because it shows what information access and protective equipment look like inside households.
For California-focused projects, CalEnviroScreen 4.0 can help connect pollution burden and socioeconomic vulnerability at the census-tract level.[13] It is not a wildfire-smoke exposure monitor. Its value is in context: which communities may already carry higher cumulative burdens, and where smoke events may intersect with poverty, housing conditions, language access, existing pollution, or limited adaptive capacity.
This is also where a paper can stop sounding like smoke affects everyone in the same way. Two neighborhoods can share a plume and still differ in indoor air filtration, job flexibility, housing quality, access to health care, and trust in alerts. The evidence should follow that difference instead of flattening it.
A workable research path for a term paper
A student paper does not need every source in the wildfire-smoke universe. It needs a sequence that matches the argument. One practical path looks like this:
- Define the event, place, and time window. Use AirNow Fire & Smoke Map to document PM2.5 conditions and smoke context, while noting the type of data layer used.[2]
- Describe recommended protective actions. Use EPA preparedness or clinical guidance for exposure-reduction advice, not as proof of disease burden.[3][4]
- Establish health evidence. Use Reid 2016 and Liu 2015 for review-level respiratory findings, then add newer large-scale work if your question involves medium-term outcomes.[5][6][8]
- Add scale carefully. Use Johnston 2012 for the published 339,000 annual global premature-deaths estimate, while making clear that it is a 2012 estimate.[7]
- Use forecasts, models, or inventories only if the paper asks about smoke movement, emissions, or exposure modeling.[9][10][11]
- Add equity evidence when the paper discusses preparedness, vulnerability, or unequal protection, especially using field studies or tract-level vulnerability tools.[12][13]
That path also makes literature reviews easier to write. The map gives the event context. The guidance explains public-health response. The reviews and epidemiology support health claims. The models explain transport or emissions when needed. The equity sources show who had the resources to respond and who did not.
What to leave uncertain
Some uncertainty should stay visible in the final paper. Chronic exposure to repeated wildfire-smoke seasons remains harder to characterize than acute or medium-term exposure. Exposure assessment is also a persistent methodological problem: monitors, satellites, sensors, and modeled products each capture different pieces of the smoke-exposure picture. A paper that names those limits will usually be more credible than one that pretends the data are cleaner than they are.
The strongest wildfire smoke air quality papers are not the ones with the most sources. They are the ones where every claim is matched to the right evidence: maps for conditions, guidance for protective actions, reviews and epidemiology for health effects, models for transport and emissions, and equity studies for unequal exposure and preparedness.
References
- Wildfire smoke impacts health, Stanford Report, 2025, link
- AirNow Fire and Smoke Map, AirNow, link
- Smoke-Ready Toolbox for Wildfires, U.S. Environmental Protection Agency, link
- Wildfire Smoke and Your Patients' Health, U.S. Environmental Protection Agency, link
- Critical Review of Health Impacts of Wildfire Smoke Exposure, Environmental Health Perspectives, 2016, link
- A systematic review of the physical health impacts from non-occupational exposure to wildfire smoke, Environmental Research, 2015, link
- Estimated Global Mortality Attributable to Smoke from Landscape Fires, Environmental Health Perspectives, 2012, link
- Wildfire smoke may affect health for months, Harvard Gazette, June 2025, link
- Smoke Outlooks, Interagency Wildland Fire Air Quality Response Program, link
- AirFire Tools, U.S. Forest Service AirFire, link
- FINN Fire INventory from NCAR, National Center for Atmospheric Research, link
- Exposure to Wildfire Smoke Among Low-Income Populations: A Health Equity Issue, International Journal of Environmental Research and Public Health, 2023, link
- CalEnviroScreen 4.0, California Office of Environmental Health Hazard Assessment, link
Comments
Join the discussion with an anonymous comment.