
A Student's Guide to Analyzing NVIDIA Stock
Learn how to evaluate any stock by walking through NVIDIA's real financial data. This step-by-step guide teaches students the fundamental analysis framework using NVIDIA's Q1 FY2027 earnings as a concrete example.
Updated:
A useful NVIDIA stock analysis for students does not start with a stock chart. It starts with a basic question: what is NVIDIA actually selling, and who is paying for it?
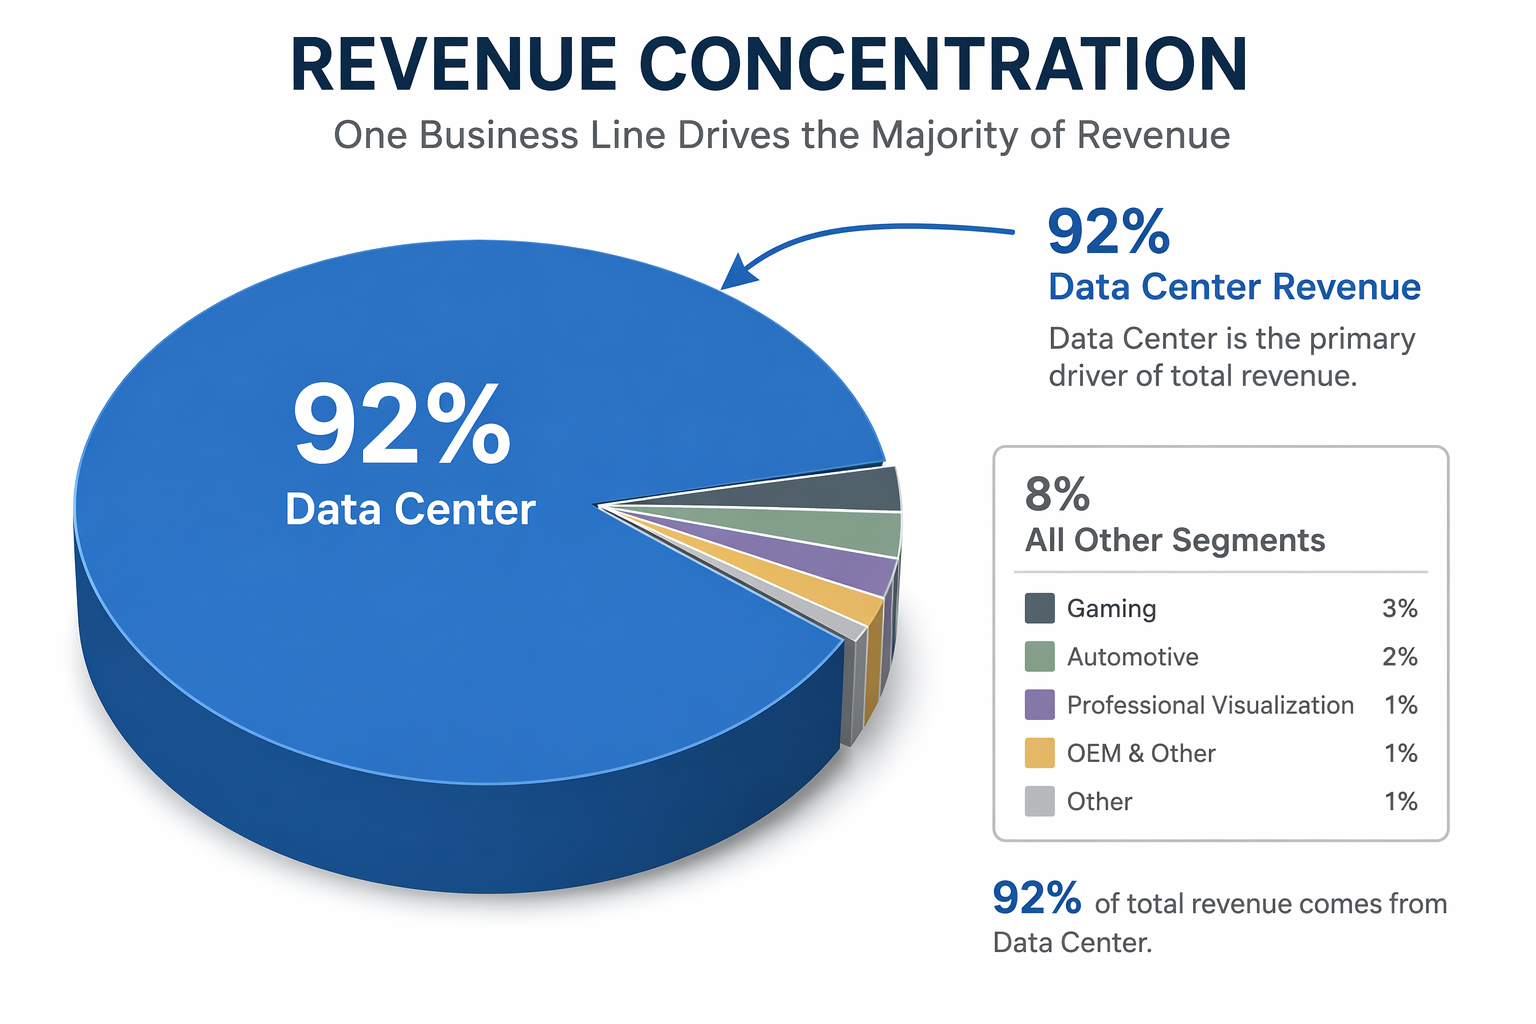
In Q1 FY2027, NVIDIA reported total revenue of $81.6 billion. Its Data Center segment produced $75.2 billion of that total, or about 92% of revenue.[1] That one fact does more teaching than a dozen finance vocabulary cards. NVIDIA is not a company where gaming, automotive, professional visualization, and data centers are all carrying equal weight. For this quarter, the Data Center business is doing almost all the lifting.
That is the first habit to build when studying any stock: before arguing whether the price is high or low, identify the business line that creates the money. A stock ticker hides the company. Segment revenue brings it back into view.
Start With The Business Model, Not The Stock Price
NVIDIA is often described as an AI chip company, but for stock analysis that label is too loose. The cleaner version is: NVIDIA sells computing hardware, software, and related systems that help customers run graphics, accelerated computing, and artificial intelligence workloads. In the quarter we are using, the Data Center segment is the center of the story because cloud providers, AI labs, enterprises, and governments need large amounts of compute capacity.
Revenue concentration is not automatically good or bad. It simply means one part of the business matters far more than the others. If Data Center demand keeps growing, NVIDIA benefits heavily. If Data Center customers slow spending, delay orders, design their own chips, or face export restrictions, the same concentration can turn into fragility.
| Question | What NVIDIA Shows In Q1 FY2027 | Why Students Should Care |
|---|---|---|
| Where does the money come from? | Data Center generated $75.2B of $81.6B total revenue. | One segment dominates the company’s current results. |
| Is the business diversified? | Not evenly across equal divisions in this quarter. | A strong story can still depend on a narrow source of revenue. |
| What should you watch next? | Data Center demand, large customer spending, export rules, and competition. | The key risk is tied to the same area producing the growth. |
Walk Down The Income Statement
The income statement is where a company’s business model becomes numbers. It answers a sequence of questions: how much did the company sell, how much did it keep after making the product, how much did it keep after running the business, and how much belonged to shareholders at the end?
For Q1 FY2027, NVIDIA reported revenue of $81.6 billion, up 85% year over year. It also reported operating income of $53.5 billion and net income of $58.3 billion.[1] Those are the raw figures. The analysis begins when you connect them.
- Revenue is the top line: the money customers paid before expenses.
- Gross profit is what remains after the direct cost of producing and delivering the product.
- Operating income is what remains after regular business expenses such as research, sales, and administration.
- Net income is the bottom line after taxes, interest, and other items.
- EPS, or earnings per share, translates total profit into a per-share number.
The reason this order matters is that each line removes a different kind of cost. A company can have impressive revenue and weak profits if production costs or operating expenses eat up the money. NVIDIA’s Q1 FY2027 numbers show the opposite: a very large portion of revenue survived through the income statement.
Margins Turn Big Numbers Into Comparable Numbers
Revenue alone is hard to compare. A $10 billion company and an $80 billion company are different sizes, so students need percentages. That is what margins do.
| Metric | Simple Formula | NVIDIA Q1 FY2027 Teaching Point |
|---|---|---|
| Gross margin | Gross profit ÷ revenue | NVIDIA reported a 74.9% gross margin, meaning a large share of revenue remained after direct costs.[1] |
| Operating margin | Operating income ÷ revenue | $53.5B operating income on $81.6B revenue shows unusually strong operating profitability.[1] |
| Net margin | Net income ÷ revenue | $58.3B net income on $81.6B revenue shows how much profit remained at the bottom line.[1] |
A margin is not a personality score for a company. It is a survival rate for money. If NVIDIA brings in a dollar of revenue, the margin tells you how much of that dollar survives to a later line on the income statement.
That is why margins are especially useful for students. Instead of saying “NVIDIA makes a lot of money,” you can say something more exact: NVIDIA’s recent revenue is large, and its reported profitability shows that much of that revenue is turning into profit rather than disappearing into costs.
EPS Is Profit Translated Into Share Language
Companies report total net income, but stocks trade per share. EPS, or earnings per share, bridges that gap. It tells you how much profit belongs to each share, based on the company’s share count.
NVIDIA reported GAAP EPS of $2.39 and non-GAAP EPS of $1.87 for Q1 FY2027.[1] GAAP means the result follows standard accounting rules and includes the items those rules require. Non-GAAP adjusts the accounting result, often to remove items management believes do not reflect normal operations. Non-GAAP can be useful, but it should not be accepted automatically just because it looks cleaner.
When students see both numbers, the point is not to pick the one they like better. The point is to ask what changed between them. If a company emphasizes adjusted earnings, read what was adjusted. If the adjustment is large, ask whether the excluded item is truly unusual or likely to repeat.

Use P/E To Study Expectations, Not To Crown A Winner
The price-to-earnings ratio, or P/E, compares a company’s stock price with its earnings per share. A simple version looks like this: if a stock trades at 30 times earnings, investors are paying $30 for each $1 of annual earnings. That sounds simple until two websites show two very different P/E ratios for the same company.
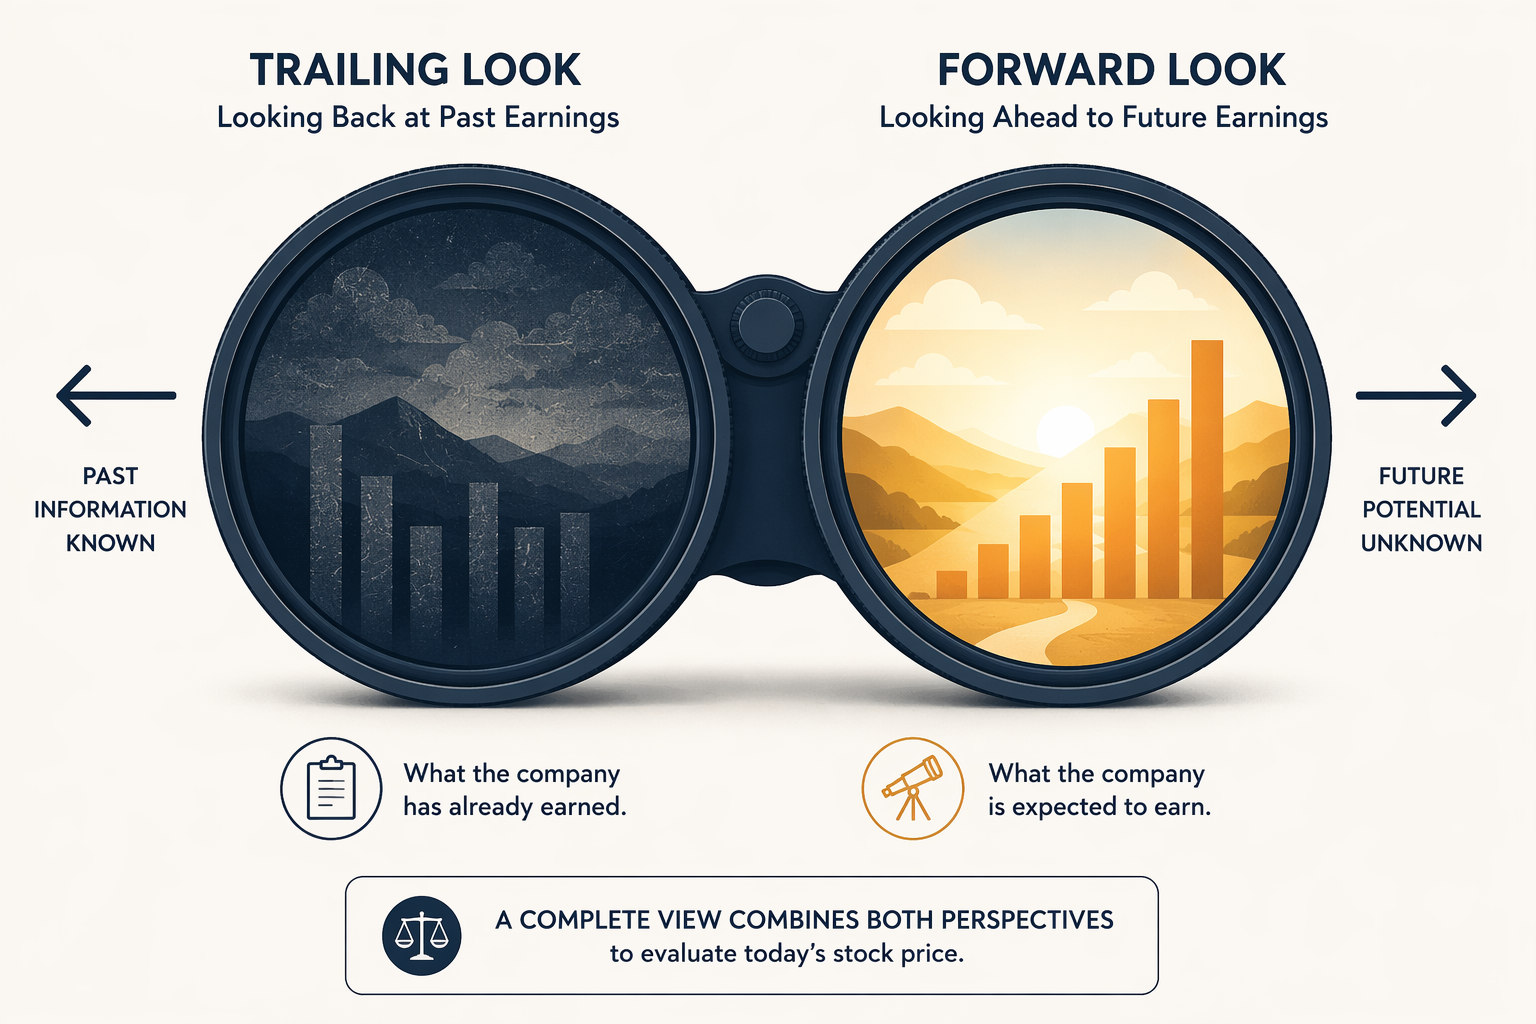
For NVIDIA, one analysis cited a trailing P/E of about 42.72, while another cited a forward P/E of about 21.7x.[2][3] Those numbers do not have to match because they are looking in different directions.
| P/E Type | What It Uses | What It Teaches |
|---|---|---|
| Trailing P/E | Past earnings | What investors are paying compared with earnings the company already reported. |
| Forward P/E | Expected future earnings | What investors are paying compared with earnings analysts expect the company to generate. |
A lower forward P/E usually means analysts expect earnings to grow. If the price stayed similar while expected earnings rose, the future-looking ratio would fall. That does not prove the stock is cheap. It proves the valuation depends heavily on future earnings actually arriving.
This is one of the easiest places for beginners to get tricked by a single number. A high trailing P/E can look scary. A lower forward P/E can look comforting. Both can be reasonable snapshots, and both can be wrong if the earnings base changes. The student move is to ask what earnings number sits underneath the ratio.
Live valuation metrics also change daily as stock prices move and earnings estimates update. Any P/E ratio from an article, brokerage screen, or research note should be treated as a timestamped snapshot, not a permanent label.
Check The Balance Sheet Before Getting Too Impressed
The income statement tells you how the company performed over a period. The balance sheet tells you what the company owns and owes at a point in time. For a first pass, students can keep this simple: compare cash with debt.
NVIDIA was described in 2026 market analysis as having a market capitalization around $5 trillion, cash of $13.2 billion, and total debt of $8.5 billion.[2][4] Cash above debt does not make a stock automatically attractive, but it does suggest the company is not being forced to fund its future from a weak financial position.
That rule of thumb is useful because it keeps the analysis grounded. A fast-growing company with heavy debt might still succeed, but the debt changes the risk. A profitable company with more cash than debt has more room to invest, absorb shocks, or wait through a slower period.
Then Ask Whether The Numbers Can Continue
Only after the financial base is clear does the qualitative layer become useful. Words like moat, competition, and risk are easier to judge after you know what they are protecting or threatening.
NVIDIA’s moat is often tied to CUDA, its software ecosystem for accelerated computing. The basic idea is switching cost: if developers, researchers, and companies have built workflows around CUDA, moving to a rival platform is not as simple as swapping one part number for another. That does not make NVIDIA unbeatable, but it helps explain why customers may keep buying even when competitors exist.[3]
Demand is another part of the case. Jensen Huang said Blackwell GPUs were “effectively sold out,” and one analysis pointed to about $650 billion in planned data center capital spending from the big four hyperscalers this year.[3][5] For students, the important connection is not the drama of the quote. It is the chain: large cloud companies plan huge infrastructure spending, that spending supports demand for advanced chips and systems, and NVIDIA’s Data Center segment is where that demand shows up in the financial statements.
Sovereign AI adds another possible growth source. Analyses have described countries including Saudi Arabia, the UAE, India, and Japan as building national AI infrastructure.[5] That matters because it suggests demand may not come only from U.S. tech giants. But it is still a growth driver to monitor, not a guarantee that every planned project becomes NVIDIA revenue.
The Risks Belong In The Same Conversation
The bear case does not require pretending NVIDIA is weak. It asks what could make today’s strong numbers harder to repeat.
- Competition: AMD’s MI350 products are part of the challenge to NVIDIA’s AI accelerator position.[5]
- Custom chips: Google, Amazon, and Microsoft have incentives to design more of their own silicon instead of buying every accelerator from outside suppliers.[2][3]
- Export controls: restrictions affecting China can cut off or limit revenue opportunities.[2]
- Customer concentration: if a small group of very large buyers drives demand, their spending decisions can matter a lot.[5]
These risks are not separate from the earlier financials. They point back to the same 92% Data Center concentration. If the dominant segment keeps growing, the company’s results can remain powerful. If the dominant segment weakens, the whole stock analysis changes quickly.
Treat Analyst Targets As Opinions To Inspect
Analyst ratings can be helpful, but they are not weather forecasts. One roundup reported 57% Strong Buy ratings, 41% Buy ratings, and a consensus target near $304, implying about 45% upside from roughly $209.[5] That tells you professional sentiment was very positive in that snapshot. It does not tell you the future.
A better use of analyst work is to compare assumptions. What revenue growth are they expecting? What margin are they using? How much competition are they building into the model? What is the difference between the highest and lowest targets? If the target price changes after earnings, ask which assumption changed.
A Reusable Student Checklist For Any Stock
NVIDIA is a good teaching specimen because the numbers are unusually visible: one segment dominates revenue, profitability is clear, valuation depends on future expectations, and the major risks are easy to name. The same method works on less famous companies too.
- How does the company make money, and which segment matters most?
- Is revenue growing, and how much of it becomes gross profit, operating income, and net income?
- What do EPS and P/E say, and are the ratios based on past earnings or future estimates?
- Does the balance sheet show enough cash, manageable debt, and financial flexibility?
- What moat could protect the business, and what risks could weaken the numbers?
This framework is for learning, not for making a buy or sell call. Stock prices, ratios, analyst targets, and estimates change constantly, especially for a company as closely watched as NVIDIA. The useful skill is moving in order: business model, income statement, valuation, balance sheet, moat, and risk. Once that order becomes familiar, a stock stops looking like a scoreboard and starts looking like a company you can actually study.
References
- NVIDIA Announces Financial Results for First Quarter Fiscal 2027, NVIDIA Newsroom.
- NVIDIA Stock Analysis & Investment Guide, Phemex.
- Nvidia Stock Is Flat for 2026. Time to Cash Out or Buy?, The Motley Fool, July 4, 2026.
- NVIDIA (NVDA) stock analysis: Buy, sell, or hold in 2026?, Finbold.
- NVDA Stock Forecast 2026, Intellectia.
Comments
Join the discussion with an anonymous comment.