
SAT Exam Hub
How to Read a Northern Lights Forecast: A Step-by-Step Study Guide
Learn to interpret the key metrics of an aurora forecast—Kp index, Bz, solar wind speed, and local magnetometer readings—and how to combine them into a practical go/no-go decision for viewing the northern lights.
- SAT
- ACT
- GRE
- MCAT
- ASVAB
- digital-sat
- adaptive-testing
- registration-fee
- content-outline
- score-target
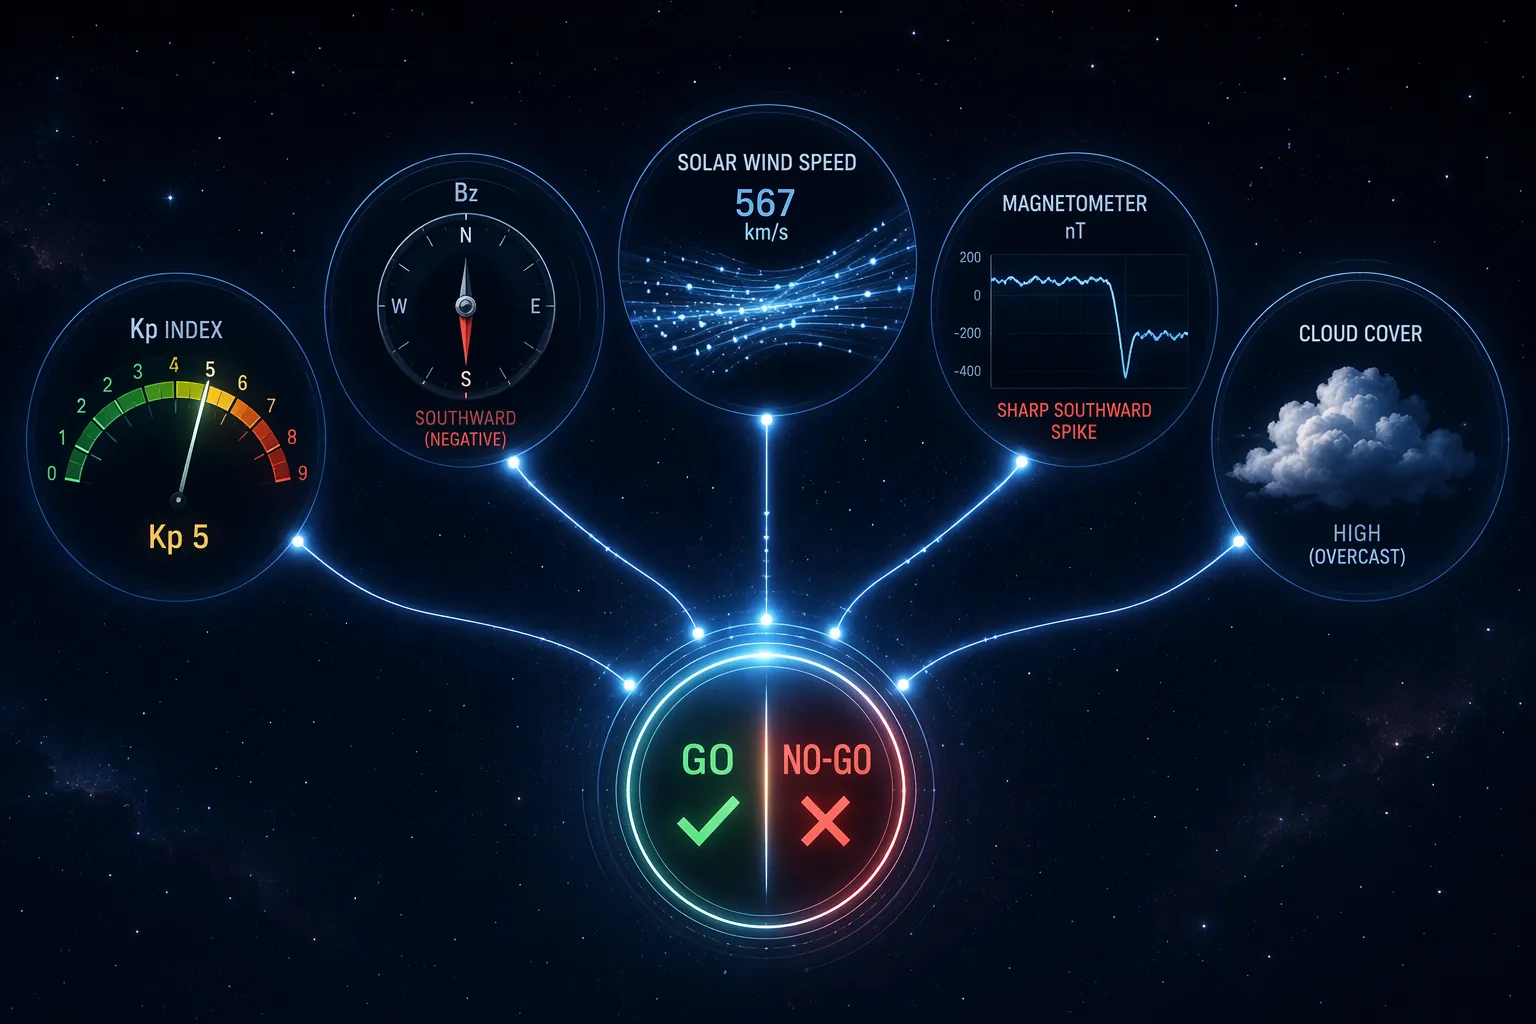
A northern lights forecast starts to look less mysterious once you stop asking one number to make the decision. Kp tells you how far the auroral oval may expand. Bz tells you whether Earth’s magnetic field is actually connecting well with the incoming solar wind. Solar wind speed tells you how much energy is arriving. Local magnetometers show whether the ground-level magnetic field near your region is reacting. Cloud cover decides whether any of that matters to your eyes.
That is the practical use of a northern lights forecast study guide: not to promise a display, but to help you make a defensible go/no-go call before you spend cold hours in a dark turnout. The mistake is treating Kp as the forecast. It is only one layer, and often not the layer that should decide the night.
Start With Kp, But Do Not Stop There
Kp is a global geomagnetic activity index on a 0–9 scale, reported as a 3-hour average. NOAA’s aurora tutorial gives the usual geographic shorthand: Kp 0–2 generally keeps activity near the polar or auroral oval region; Kp 5 can bring visibility into the northern United States; Kp 7 can extend possible visibility toward places such as Pennsylvania and Iowa; Kp 9 can reach as far south as Texas and the Gulf Coast under strong conditions.[1]
That shorthand is useful when you are asking, “Am I far enough north for this storm to matter?” It is weak when you ask, “Will I see aurora from this exact field tonight?” Kp is global, averaged, and delayed compared with the fast changes that make aurora appear and fade.
There is also a geographic trap. Inside the auroral oval, especially above about 65° magnetic latitude, aurora can be active even during Kp 0–2 conditions.[1] A beginner in Fairbanks, Tromsø, or a similar high-latitude location can miss good local context by dismissing a low Kp number. A beginner much farther south can make the opposite mistake: seeing Kp 5 or 6 and assuming the sky will perform on schedule.
| Kp reading | What it suggests | How to use it |
|---|---|---|
| 0–2 | Aurora mostly near the polar or auroral oval region | Still meaningful if you are already inside or near the oval |
| 5 | Geomagnetic storm level with possible northern U.S. visibility | Worth checking real-time Bz, solar wind, local magnetometers, and clouds |
| 7 | Possible visibility farther into the mid-latitudes | Strong enough to pay attention, not strong enough to ignore timing |
| 9 | Extreme expansion toward the southern U.S. in suitable conditions | Rare upper-bound case; verify every real-time signal |
Read Bz as the Real-Time Coupling Signal
If Kp tells you the broad territory, Bz tells you whether the door is opening. Bz is the north-south component of the interplanetary magnetic field. When Bz turns southward, or negative, it couples more effectively with Earth’s magnetic field. NOAA’s tutorial identifies sustained negative Bz, especially below about -10 nT, as a key condition for visible aurora displays.[1]
For a same-night decision, Bz deserves more attention than a clean-looking Kp forecast. A predicted Kp 6 with Bz hovering weakly northward is not the same thing as Kp 5 with Bz dropping hard below -10 nT. The second setup may be more convincing because the incoming solar wind is connecting with the magnetosphere in the direction that favors auroral activity.
Do not treat one brief dip as a guarantee. A quick negative spike can be interesting; sustained southward Bz is more useful. The practical question is whether Bz is staying negative long enough to energize the system while darkness and clear sky overlap at your location.
Pair Solar Wind Speed With Bz
Solar wind speed is the next number beginners often overrate by itself. NOAA describes normal solar wind speed as below about 400 km/s, elevated speed as above 500 km/s, and strong speed as above 700 km/s.[1] Higher speed means more energy is available, but energy that does not couple well can still disappoint.
The better habit is to read speed and Bz together. Solar wind above 500 km/s with Bz negative is more interesting than the same speed with Bz northward. Solar wind above 700 km/s with Bz below -10 nT is the kind of pairing that deserves serious attention, assuming you are within the possible visibility zone and not under clouds.[1]
- Weak setup: low or ordinary solar wind speed, Bz near zero or northward, no local magnetic movement.
- Watch setup: solar wind rising above 500 km/s, Bz turning negative, Kp forecast high enough for your latitude.
- Strong setup: solar wind above 700 km/s, Bz sustained below -10 nT, local magnetometer reacting, clear northern sky.
These are not grades from a prediction service. They are a way to stop treating a single green app icon as a plan.
Use Local Magnetometers as a Reality Check
A local or regional magnetometer measures changes in Earth’s magnetic field, usually shown as a trace moving in nanoteslas. When auroral currents strengthen overhead or nearby, the trace can swing sharply. For viewing decisions, a sudden negative nT drop is often more useful than a smooth, quiet line because it shows the magnetic field is being disturbed now, not merely predicted to be disturbed later.
UAF’s aurora forecast tools and related monitoring pages are useful because they put local observation back into the decision instead of leaving you with a planetary average.[2] NSF’s discussion of aurora observing also emphasizes ground-based magnetometer chains and upper-atmosphere measurements as part of how scientists track auroral activity, including during major storm conditions.[3]
The beginner move is to look only at whether the forecast says “active.” The better move is to ask whether the nearest relevant magnetometer has started behaving like something is happening. If Kp is favorable, Bz is southward, solar wind is fast, and the magnetometer trace drops sharply, the case for going out becomes much stronger.
Let Clouds Veto the Plan
Cloud cover is not a space weather metric, but it is the most efficient way to ruin a correct forecast. A strong aurora behind an overcast sky is still invisible. NOAA’s viewing guidance treats clear, dark skies away from city lights as a practical requirement for seeing aurora well.[4]
Use cloud forecasts differently from space weather forecasts. Space weather tells you whether the aurora may be active. Cloud cover tells you whether your chosen location can use that activity. If the sky is mostly cloudy where you are, the decision is not automatically “no,” but the question changes: is there a reachable clearing inside the same time window?
A Practical Reading Order
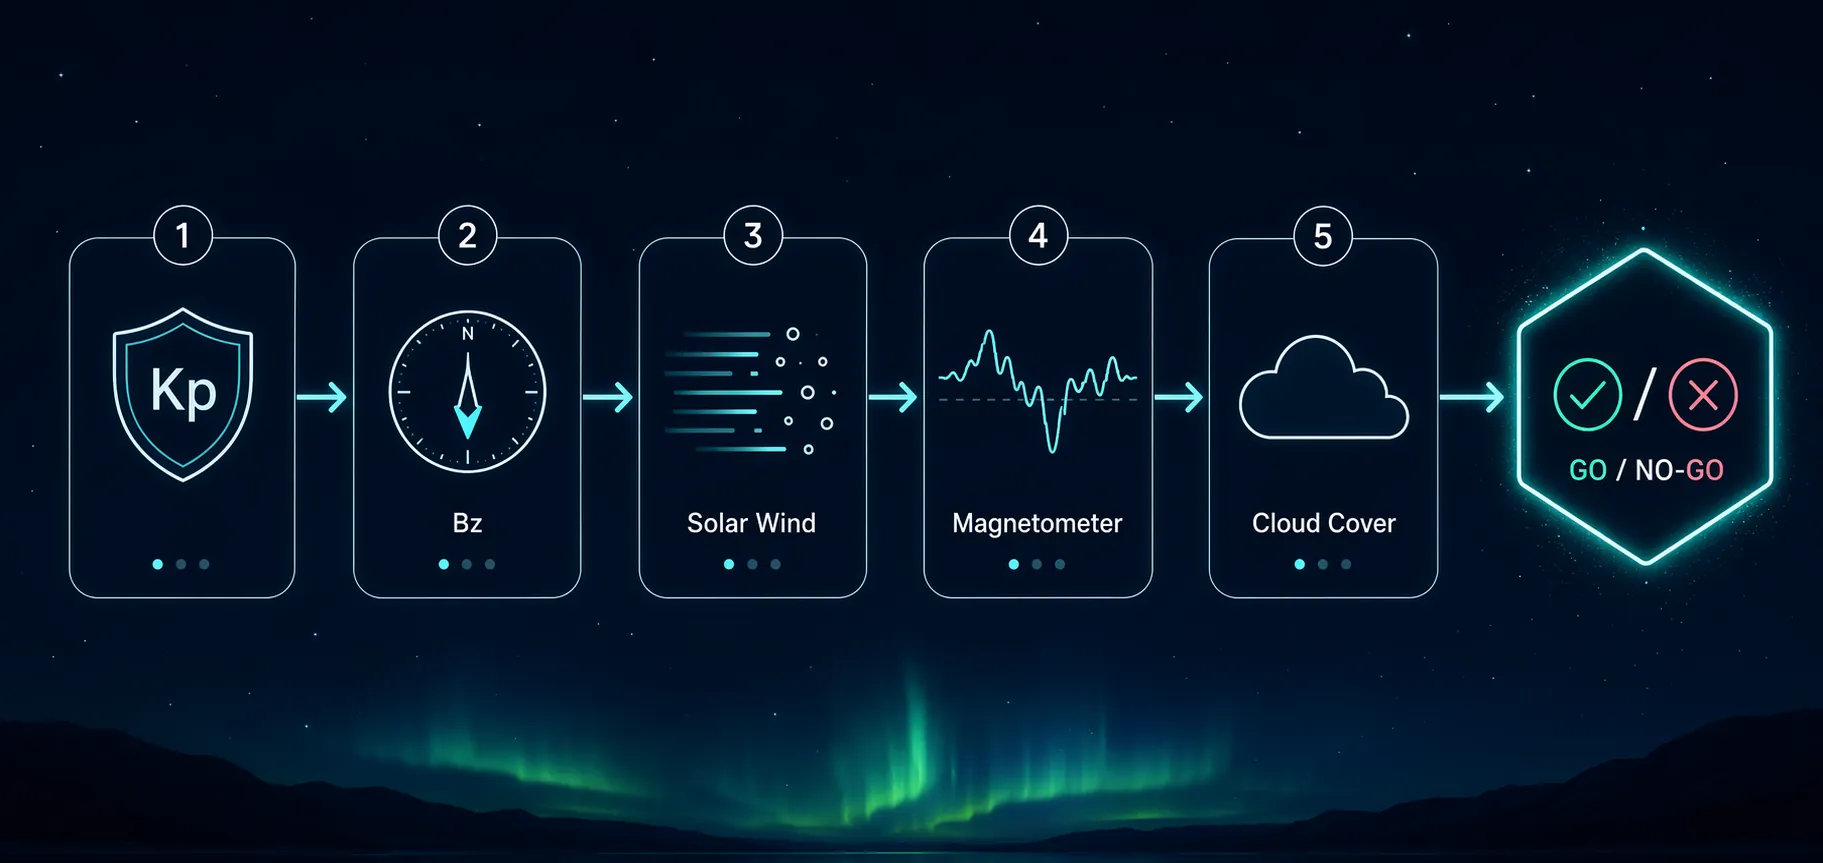
When several tabs are open and every number is moving, order matters. Start broad, then get local, then get practical.
- Check Kp for geographic reach. Ask whether the forecasted activity is high enough for your latitude, remembering that high-latitude locations can still see aurora at low Kp.
- Check Bz. Give more weight to sustained southward values, especially below -10 nT, than to a generic “high chance” alert.
- Check solar wind speed. Treat above 500 km/s as elevated and above 700 km/s as strong, but only get excited when Bz is also favorable.
- Check a regional magnetometer. Look for sharp movement, especially negative nT drops, rather than a quiet line.
- Check clouds, moonlight, darkness, and horizon. A clear northern view can matter more than driving to a famous spot under worse sky.
If you need background on the physical chain behind those numbers, it helps to first learn how northern lights form. If you need tool sources rather than interpretation, keep a separate list of evidence-graded aurora forecast resources so the decision process does not turn into a browser scavenger hunt.
Know Which Forecast Window You Are Using
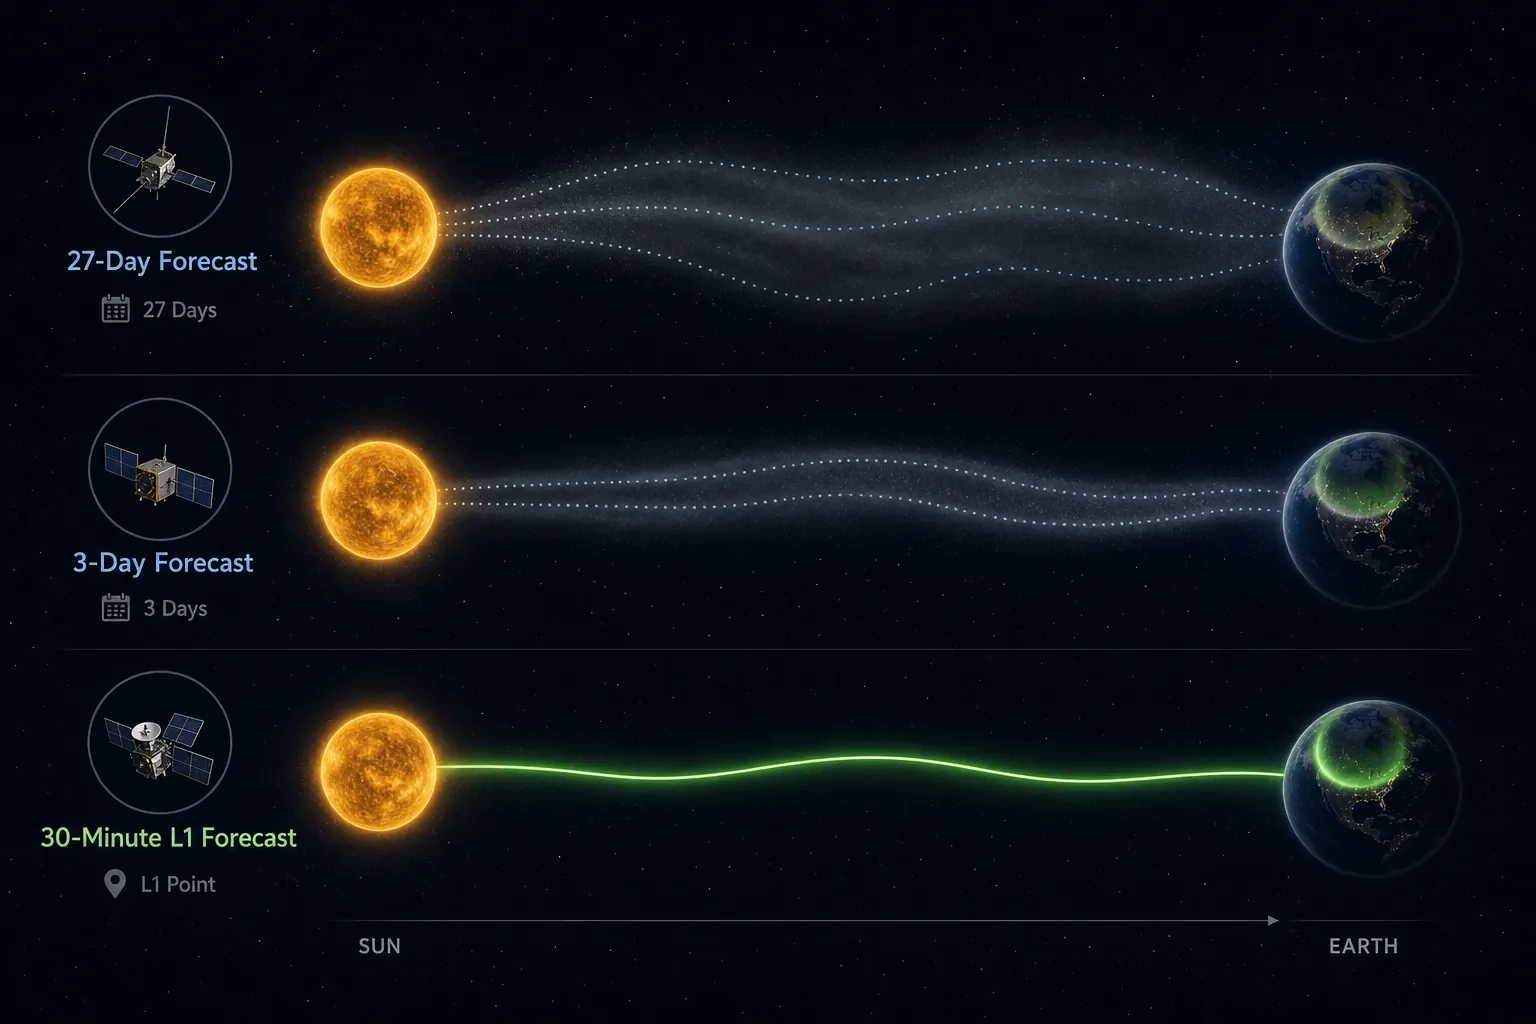
Aurora forecasts do not all answer the same question. NOAA describes three useful time windows: a 27-day outlook based on solar rotation, a 3-day forecast based on observed solar features such as coronal holes and coronal mass ejections, and a 30-minute forecast based on solar wind measurements from spacecraft at the L1 point between Earth and the Sun.[1]
| Forecast window | Best use | How much trust to place in it |
|---|---|---|
| 27-day | Noticing recurring solar regions and planning attention | Low confidence for a specific viewing night |
| 3-day | Preparing travel flexibility and watching likely storm timing | Moderate confidence, weaker for strong events |
| 30-minute L1 | Same-night go/no-go decisions | Most reliable short-term window |
The L1 point is about 1.5 million km sunward of Earth, so satellites such as DSCOVR and ACE see the solar wind shortly before it reaches the planet. The warning time is commonly only about 15–60 minutes.[1] That short lead time is frustrating if you want certainty before dinner. It is also why the 30-minute forecast is the window to take seriously when the car keys are already on the table.
Longer forecasts are still useful. A 27-day outlook can tell you when to pay attention. A 3-day forecast can tell you whether to keep an evening flexible. Neither should be treated like a reservation with the sky.
High Kp Forecasts Need More Caution, Not Less
The most exciting forecasts are often the least stable. A 2025 analysis in the Journal of Young Physicists, based on a March–June 2025 dataset, found that low-activity Kp 0–3 conditions could be forecast with more consistency, while high-activity Kp 6–9 events became unpredictable beyond short lead times because of chaotic magnetosphere dynamics.[5]
That is a limited dataset, not a final verdict on every aurora forecast model. But the caution matches what experienced forecast readers already practice: the higher the advertised activity, the more you should verify the real-time stack before making the drive. A high Kp forecast is a reason to watch Bz, solar wind, magnetometers, and clouds more carefully, not a reason to stop checking them.
What a Fully Activated Forecast Can Look Like
The May 2024 G5 geomagnetic storm is the cleanest recent example of the whole system lighting up. It was the strongest geomagnetic storm since 2003, and aurora were reported as far south as Texas, Mexico, and the Caribbean.[3] That is what an exceptional case can do when the auroral oval expands far beyond its ordinary boundaries.
The lesson is not that mid-latitude viewers should expect Texas-level aurora whenever an app turns green. The lesson is that rare extreme storms require the same reading habits as ordinary nights, only with stronger signals: very high Kp, strongly southward Bz, fast solar wind, active magnetometers, and workable local sky conditions.
If you are trying to understand the broader consequences of G-scale storms beyond skywatching, keep that separate from the viewing decision. Space weather can affect technology and infrastructure, but that is a different question from whether your northern horizon is clear enough tonight; a focused overview of what geomagnetic storms do to technology, weather, and life belongs in that lane.
The Go/No-Go Habit
A reasonable go/no-go decision does not need drama. It needs agreement between the numbers that matter most for your place and time.
- Go, or at least strongly consider going, when Kp is high enough for your latitude, Bz is sustained southward, solar wind is elevated or strong, a regional magnetometer is moving sharply, and the sky is clear enough during darkness.
- Wait and watch when Kp is promising but Bz is weak, solar wind has not arrived, or the magnetometer trace is quiet.
- Do not go far on space weather alone when clouds block the viewing direction and no reachable clearing lines up with the active window.
- Treat low Kp differently if you are inside the auroral oval; local magnetometers and sky conditions may matter more than the global index.
The cleanest sequence is simple enough to write in a notebook: use the 27-day and 3-day forecasts to decide when to pay attention, then use the 30-minute L1 data for the serious go/no-go call. Kp sets the possible reach. Bz and solar wind show whether the incoming energy is useful. Magnetometers show whether the region is responding. Clouds decide whether you can see anything at all.
Once you can make that sequence without outsourcing the judgment, the forecast becomes less like a promise and more like a set of conditions you know how to weigh. That is the difference between chasing a number and reading the night.
References
- NOAA / SWPC Aurora Tutorial — NOAA / SWPC
- Geophysical Institute, UAF — Aurora Forecast — Geophysical Institute, UAF
- NSF Science Matters — How to Catch an Aurora — NSF Science Matters
- NOAA / SWPC Tips on Viewing the Aurora — NOAA / SWPC
- Forecasting The Aurora: The Art Of Uncertainty — Journal of Young Physicists
Related exhibits & inventory
Verified outcomes
No verified outcomes on file for this exam yet
See Methodology for how outcome evidence is disclosed once logged.
Planners
No planner filed for this exam yet
A downloadable timeline template for this exam hasn't been published yet.
Tool verdicts
AI-tool cautions
No AI tools tested for this exam yet
No hands-on AI-accuracy logs have been filed for this exam.
Questions about this plan
Ask a question about a specific section, timeline, or citation in this plan — or flag something that needs correcting.
Comments
Join the discussion with an anonymous comment.