
SAT Exam Hub
July 2026 Aurora Forecast Data for Your School Project
Students can use real July 2026 aurora forecasts — including a confirmed G3 storm on July 3–4 and multiple Kp 4+ events — as primary-source data for a science project. This article explains how to analyze the Kp index, NOAA tools, moon phases, and storm probabilities using citable sources.
- SAT
- ACT
- GRE
- MCAT
- ASVAB
- digital-sat
- adaptive-testing
- registration-fee
- content-outline
- score-target
If you need real July 2026 aurora forecast data for a school project, start with the dates that can actually be checked: July 3-4, July 12, July 22, and July 24. The cleanest case is July 3-4. The Geophysical Institute aurora forecast listed July 4 at Kp 7.33, while its other high July entries included July 12 at Kp 4.67 and July 22 at Kp 4.0.[1] Those are not decorative numbers. They let you ask a testable question: when the Kp index rose, how far south could aurora visibility reasonably extend?
As of July 23, 2026, some July events are no longer just forecasts. July 3-4 is useful as a historical case study because the storm has already happened. July 22 can be treated as a near-current forecast/outlook value from the Geophysical Institute. July 24, listed as active G1 conditions in AuroraAdmin's 45-day forecast, is still forecast material at this date and should be labeled that way in a project notebook.[2]
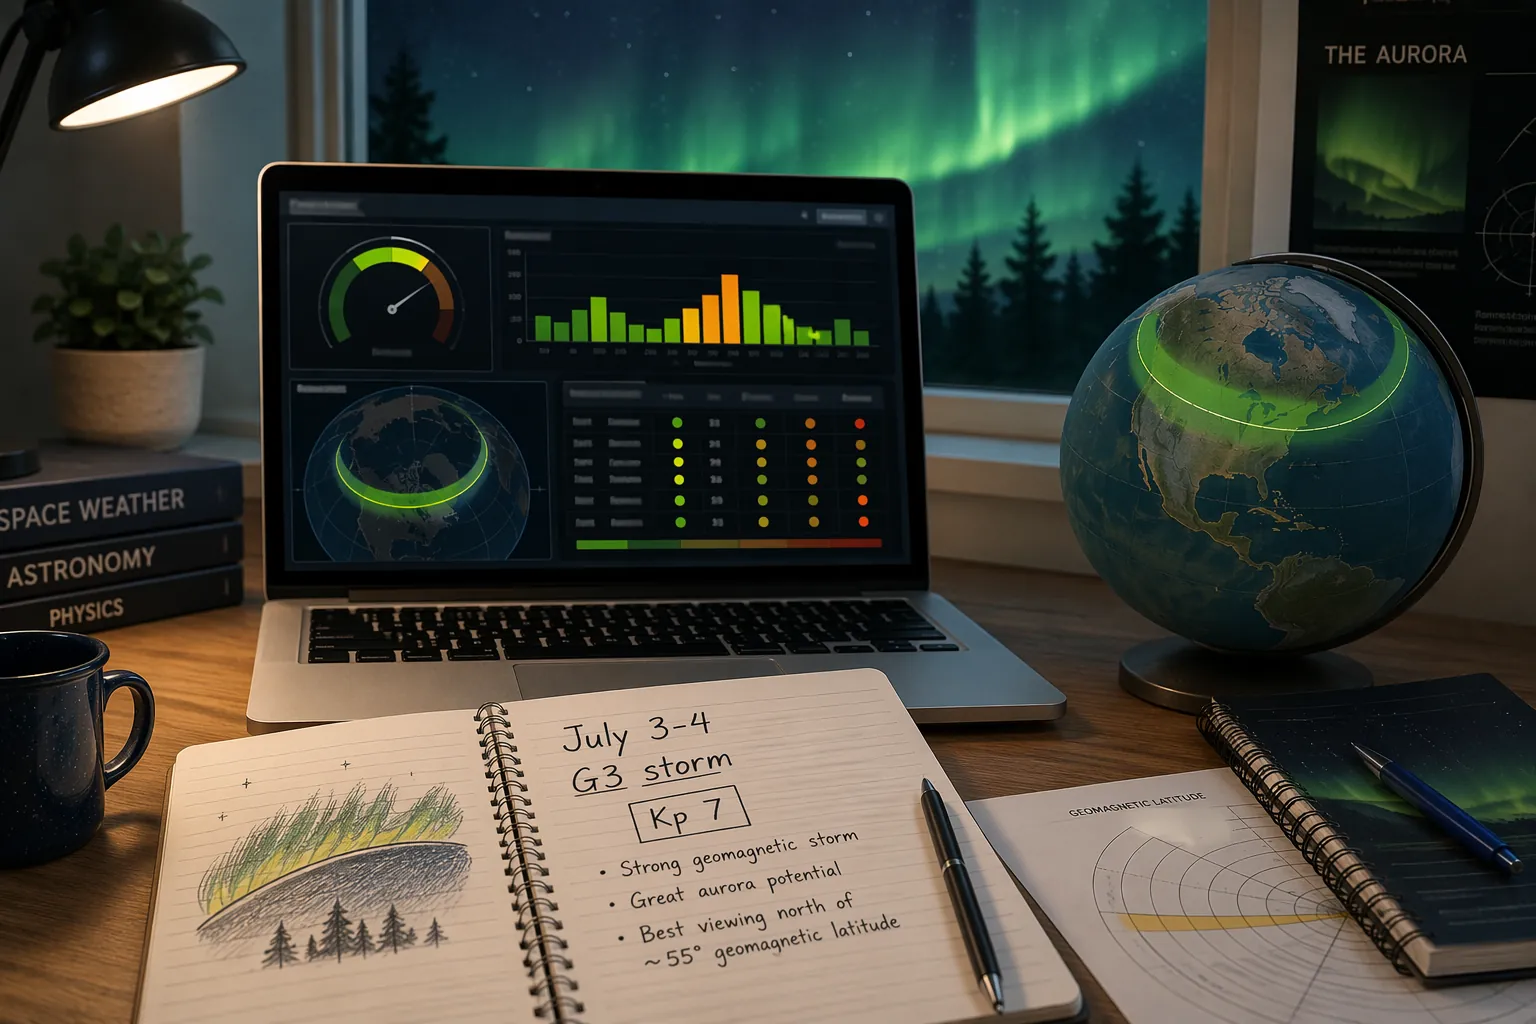
The July 2026 Data Worth Putting in Your Project
A workable project does not need every aurora post on the internet. It needs a small set of dates, the forecast source for each date, the index or storm level reported, and a way to compare that number with possible visibility. This is the July 2026 evidence block I would want to see before any poster board gets decorated with green curtains of light.
| Date | What to record | Best use in a school project | How to label it as of July 23, 2026 |
|---|---|---|---|
| July 3-4, 2026 | Strong geomagnetic storm case; July 4 Kp 7.33 in Geophysical Institute data | Main case study for testing whether high Kp expands possible aurora visibility southward | Historical event / case-study data |
| July 12, 2026 | Kp 4.67 in Geophysical Institute data | Comparison date: elevated activity, but not the same level as July 3-4 | Historical or near-historical data, depending on the source page captured |
| July 22, 2026 | Kp 4.0 active day in Geophysical Institute 27-day forecast | Moderate comparison point for northern-state visibility expectations | Current forecast/outlook value |
| July 24, 2026 | Active G1 conditions in AuroraAdmin 45-day forecast | Example of a longer-range outlook that should not be treated as proof of visibility | Forecast material |
That last column matters. A student who writes "July 24 will have auroras" is making a stronger claim than the available source supports. A student who writes "AuroraAdmin's 45-day outlook listed active G1 conditions for July 24, so I will compare that outlook with later observed Kp data" is doing science.
Kp Is the Bridge Between a Solar Storm and Your Town
The Kp index is useful because it gives students something better than "big storm" or "small storm." It is a planetary geomagnetic activity index. In a school project, its job is to connect activity in near-Earth space with a location on a map. NOAA's student-accessible aurora materials point students toward tools such as the 30-minute OVATION aurora forecast, the 3-day geomagnetic forecast, the 27-day outlook, geomagnetic data archives, and related real-time data sources.[3]
For July 2026, the difference between Kp 4 and Kp 7 is the difference between a mostly northern-state question and a much broader mid-latitude question. The latitude mapping supplied in the sources gives a practical school-project rule: Kp 3-4 can reach northern U.S. states, Kp 5 can reach around Pennsylvania and Ohio, Kp 7 can reach around North Carolina and Tennessee, and Kp 9 can reach as far south as Florida.[3]
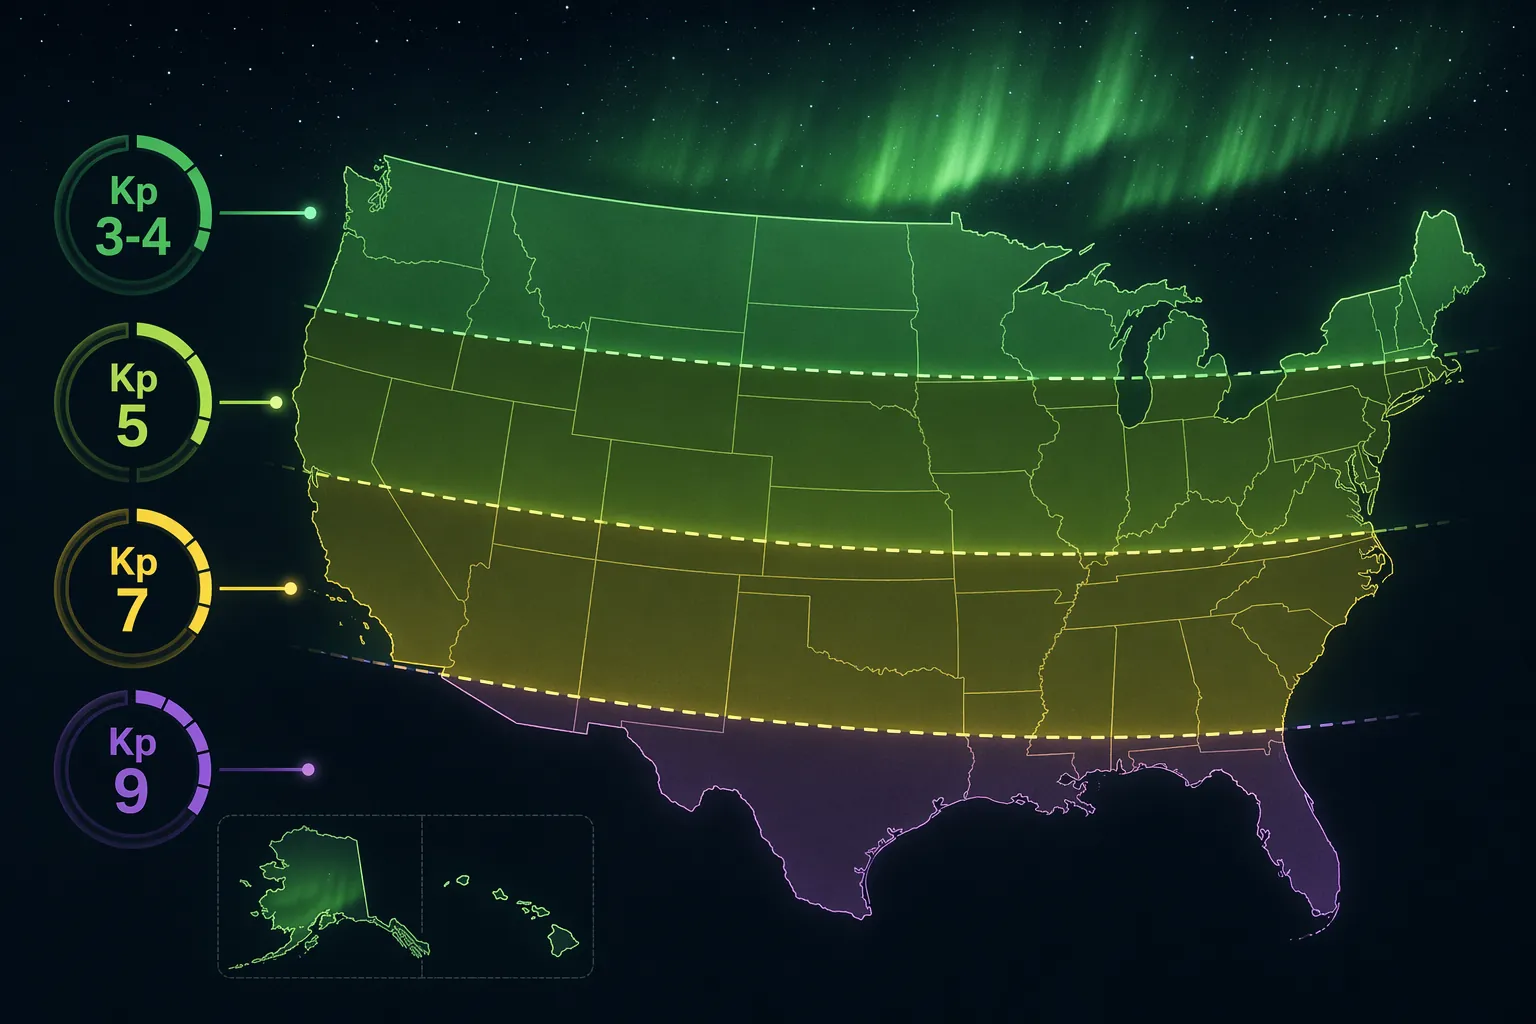
That is why July 4 deserves the most attention. A Kp value of 7.33 is not just "higher" than Kp 4. It changes which students can reasonably ask whether auroras might have been visible from their region. A student in Minnesota, Michigan, or Maine would be asking a different question from a student in North Carolina or Tennessee. During a Kp 4 day, the southern student probably should not expect much. During a Kp 7-level event, the question becomes worth checking against sky reports, cloud cover, darkness, and moonlight.
Use Kp Values as Predictions, Not Photographic Proof
Kp does not prove that a person saw auroras from a backyard. It tells you that geomagnetic conditions were strong enough to make visibility plausible in certain regions. A proper project separates those two claims. First, record the Kp value and expected visibility band. Then check observation reports, sky conditions, and timing. If nobody in your area reported aurora, that does not automatically make the forecast useless. Clouds, daylight, local light pollution, or a bright Moon can erase a visible sky event for an observer on the ground.
Why July Is a Tricky Aurora Month
The usual advice to go north is not automatically the best logic in July. High-latitude places can sit under excellent aurora zones and still be poor July observing locations because the sky does not get truly dark enough. The Geophysical Institute identifies Fairbanks aurora viewing season as August 21 to April 21, which is a useful warning for students: Arctic latitude helps with aurora probability, but July daylight works against visibility.[1]
That makes July 2026 especially interesting for a school project. The better question is not "Where is the aurora oval usually strongest?" It is "During strong July storms, did the oval expand far enough south that darker mid-latitude skies had a better chance than bright northern summer skies?" July 3-4 is the date to test that question.
Moonlight is the other July problem. AuroraAdmin's long-range forecast includes a moon phase overlay, and the July 2026 lunar calendar places the Full Buck Moon on July 29.[2] The week of July 20-24 falls under a waxing gibbous Moon, about 69% to 85% illuminated, so a student should record moderate moonlight interference for late-July viewing claims.[2]
A Project Method That Can Be Checked
Here is a clean method for turning the July 2026 aurora forecast into a real investigation rather than a report that stops after "solar storms cause auroras." You can use it for a science fair board, a data notebook, or a short class presentation.
- Choose a location. Use your town, your state, or a comparison between two latitudes.
- Choose July dates. Include July 3-4 as the strong event, then add July 12, July 22, and July 24 as comparison dates.
- Record the Kp value or storm level from each source. Keep the Geophysical Institute, NOAA tools, and AuroraAdmin in separate columns.
- Classify each source. Mark short-term forecasts and observed data separately from 27-day or 45-day outlooks.
- Compare Kp with latitude. Use the Kp visibility bands to decide whether aurora visibility was plausible from your location.
- Add viewing limits. Record moon phase, darkness, cloud cover if available, and whether citizen reports or sky images support the claim.
The most important move is step 4. A 30-minute aurora forecast is not the same kind of source as a 27-day outlook. A 45-day forecast can help you form a hypothesis, but it should not be used as proof that auroras were visible on a specific night. NOAA explicitly points students and observers toward tools with different time ranges, including the 30-minute OVATION forecast, 3-day geomagnetic forecast, 27-day outlook, and geomagnetic data archives.[3]
For a stronger version of the project, make one graph. Put the July dates on the x-axis and Kp values on the y-axis. Mark July 4 at 7.33, July 12 at 4.67, and July 22 at 4.0 from the Geophysical Institute data.[1] Then use colored bands to show your location's approximate visibility threshold. The graph will quickly show whether your town was inside the plausible zone only during the strongest storm or during several active periods.
A Hypothesis That Would Actually Be Falsifiable
Try a claim like this: "During July 2026, aurora visibility from my location should have been more plausible on July 3-4 than on July 22 because the Kp value was much higher, but local visibility also depended on darkness and moonlight." That claim can be wrong. If your location was too far south even for Kp 7, the data should show that. If your region was cloudy, observation reports may not match the geomagnetic conditions. If late-July moonlight interfered, a forecast may look stronger than the sky looked to a human observer.
A weaker claim would be: "There were auroras in July 2026 because solar storms happen." That is not an investigation. It has no location, no date, no source comparison, and no way to lose.
How to Compare the Sources Without Mixing Them Up
Use NOAA tools for official space-weather forecasting and near-term products, the Geophysical Institute for clear Kp-based aurora outlook values, AuroraAdmin for longer-range daily estimates and moon phase context, and citizen-science or observation reports only as evidence that people actually saw something. Those sources do not all answer the same question.
| Source type | What it is good for | What not to claim from it |
|---|---|---|
| NOAA SWPC aurora and geomagnetic tools | Short-term aurora forecast, 3-day geomagnetic forecast, 27-day outlook, and archived geomagnetic data | Do not treat every NOAA forecast product as the same time scale |
| Geophysical Institute 27-day aurora forecast | Simple Kp values that are easy to cite and graph for July dates | Do not treat a 27-day outlook as a guaranteed viewing report |
| AuroraAdmin 45-day forecast | Longer-range daily estimates and moon phase overlay | Do not use it alone to prove exact aurora visibility |
| Citizen reports or observed sky photos | Checking whether people reported seeing auroras from a region | Do not use one photo as proof that everyone at that latitude could see auroras |
If you want a deeper source list for this same kind of evidence sorting, use Evidence-Graded Aurora Borealis Forecast and Study Resources. If your report also needs the formation physics, keep that separate from the data analysis; Learn How Northern Lights Form with a 4-Step Memory Chain is a better place for that background than the middle of your July forecast table.
Where Solar Cycle 25 Fits
Solar Cycle 25 gives the July 2026 data some context, but it should not take over the project. NASA and NOAA placed the solar maximum in October 2024, and solar-cycle history shows that the declining phase can still produce strong storms; the 2003 Halloween G5 storms occurred two years after the Cycle 23 peak. The useful classroom point is modest: 2026 is not too late for strong geomagnetic activity just because the maximum has passed.
That background can help explain why July 2026 had enough activity to study. It should not be used to claim that any particular July night had visible auroras. For that, go back to the dated Kp values, storm levels, forecast products, and observation checks.
Project-Ready Interpretation
July 2026 is a strong real-data case study because it gives you more than a pretty sky topic. July 3-4 supplies the main high-activity case, with July 4 reaching Kp 7.33 in the Geophysical Institute data.[1] July 12 and July 22 give lower comparison values, and July 24 gives a useful example of forecast material that still needed later checking as of July 23.[1][2]
The best conclusion for a school project is careful: July 2026 aurora forecasts show that stronger geomagnetic activity increased the possible viewing range, especially during the July 3-4 event, but actual visibility depended on latitude, darkness, moonlight, weather, and whether the source was a short-term forecast, a long-range outlook, or observed data. That is a better result than a perfect-looking poster with no evidence trail.
References
- Aurora Forecast, Geophysical Institute, University of Alaska Fairbanks, https://www.gi.alaska.edu/monitors/aurora-forecast
- Aurora Forecast Long Range, AuroraAdmin, https://www.auroraadmin.com/aurora-forecast-long-range/
- Aurora Tutorial, NOAA Space Weather Prediction Center, https://www.spaceweather.gov/content/aurora-tutorial
Related exhibits & inventory
Verified outcomes
No verified outcomes on file for this exam yet
See Methodology for how outcome evidence is disclosed once logged.
Planners
No planner filed for this exam yet
A downloadable timeline template for this exam hasn't been published yet.
Tool verdicts
AI-tool cautions
No AI tools tested for this exam yet
No hands-on AI-accuracy logs have been filed for this exam.
Questions about this plan
Ask a question about a specific section, timeline, or citation in this plan — or flag something that needs correcting.
Comments
Join the discussion with an anonymous comment.