
How Moderate Geomagnetic Storms Produce Extreme Red Auroras
A 2026 study reveals that moderate geomagnetic storms (Dst −100 to −121 nT) can produce red auroras at extreme altitudes of 490–800 km when dense solar wind exceeds 30 particles/cc, challenging conventional storm-intensity indices and highlighting overlooked risks for satellites.
- SAT
- ACT
- GRE
- MCAT
- ASVAB
- digital-sat
- adaptive-testing
- registration-fee
- content-outline
- score-target
The odd part was not simply that red auroras appeared over Hokkaido. It was how high they reached. In five events from 2024 to 2025, red 630 nm oxygen emissions were estimated at 490–800 km above mid-latitude Japan, while the same storms sat in the “moderate” range by Dst, from −100 to −121 nT.[1]
That mismatch is the useful center of Nakayama and Kataoka’s 2026 study. The study is not a claim that every moderate storm is secretly extreme, or that red auroras can now be promised to anyone with a clear northern horizon. It is a more interesting claim: in dense solar wind, a storm can look modest to a common index while the upper atmosphere and near-Earth space are being pushed harder than that label suggests.[1]
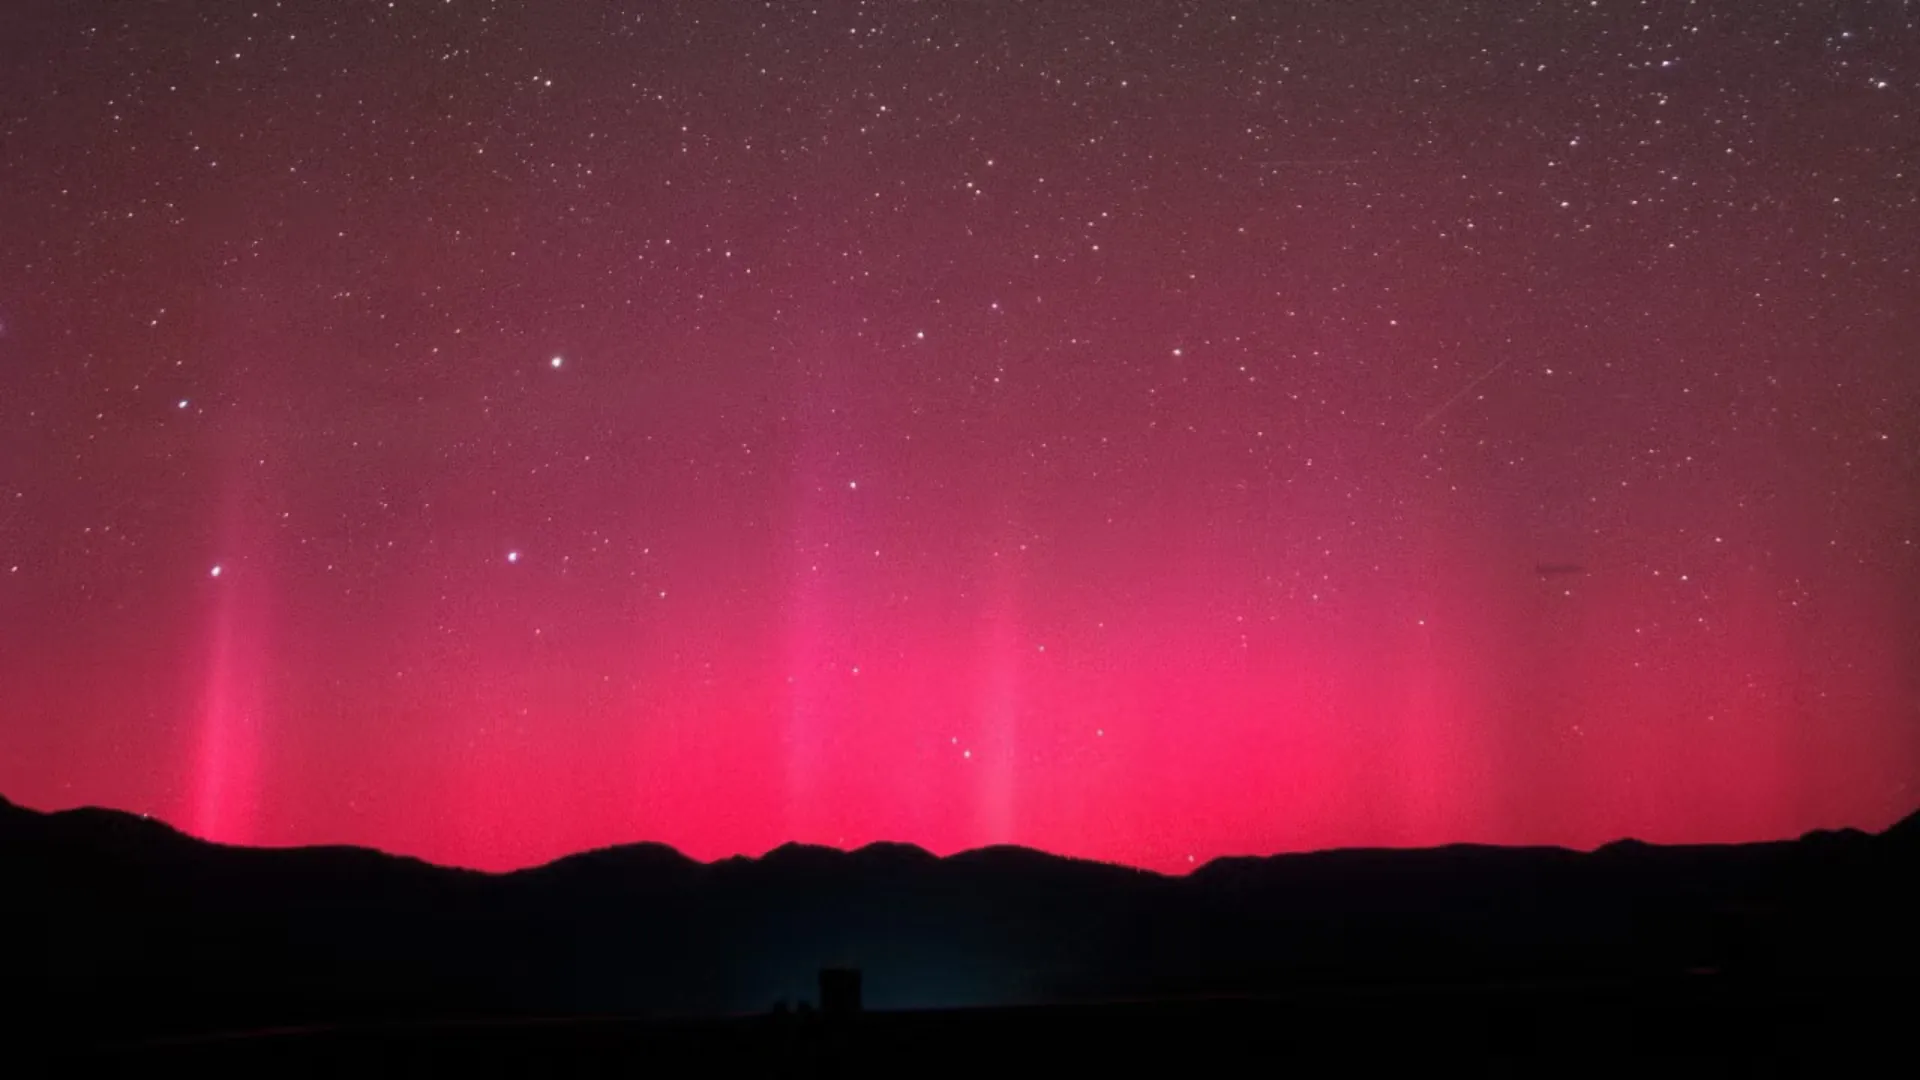
These were red auroras, not the green curtains that dominate travel posters and Arctic tourism imagery. The red line at 630 nm comes from atomic oxygen higher in the atmosphere, and the usual altitude range discussed for such emissions is far lower than the 490–800 km estimates reported here.[1] For a quick refresher on the basic chain from solar wind to atmospheric emission, the northern-lights memory-chain guide is enough background; the important point in this study is not that auroras form, but that the red emission climbed so high during storms that ordinary storm labels did not make look exceptional.
What Was Actually Measured
Nakayama and Kataoka analyzed five red-aurora events observed from Hokkaido: June 28, August 4, September 12, and November 9, 2024, plus March 26, 2025.[1] The publication appeared in May 2026, so this is a retrospective study of earlier events, not a 2026 forecast product.[1]
| Event | Observed feature | Storm context |
|---|---|---|
| June 28, 2024 | Red 630 nm aurora from Hokkaido | Moderate Dst/SYM-H storm conditions |
| August 4, 2024 | Citizen photographs preserved the event | Professional observatories were blocked by weather |
| September 12, 2024 | Citizen photographs preserved the event | Professional observatories were blocked by weather |
| November 9, 2024 | Red 630 nm aurora from Hokkaido | Moderate Dst/SYM-H storm conditions |
| March 26, 2025 | Red 630 nm aurora from Hokkaido | Moderate Dst/SYM-H storm conditions |
The citizen part of the evidence is not decorative. Two of the five events, on August 4 and September 12, 2024, were missed by Nagoya University’s professional observatories at Rikubetsu and Moshiri because of weather; citizen photographs were the record that remained.[1] Anyone who has watched aurora alerts move across a local observing group knows the problem: the useful camera is often not the most expensive one, but the one under the one gap in the clouds.
The study’s first author, Nakayama, had been making continuous observations as a citizen scientist in Hokkaido since 2021 and coordinated with Kataoka through social media forecasts to mobilize observers.[1] That matters methodologically. The photos were not random trophies gathered after the fact; they were part of a watchful observing network that could be connected back to space-weather data.
How Blurry Sky Photographs Became Altitude Evidence
A red smear over a dark horizon does not automatically become a scientific measurement. The useful step is geometry. The researchers used elevation angles from citizen photographs, then combined those sight lines with NOAA18 and MetOp3 electron flux data and International Geomagnetic Reference Field magnetic-field-line modeling to estimate where the emitting oxygen sat along the field line.[1]
That combination is the reason the photographs carry weight. A single image can show that something was visible; it cannot by itself prove altitude. Satellite electron measurements help identify where precipitating particles were present. Field-line modeling supplies the magnetic geometry. The photo elevation angles tie the observer’s ground view to that geometry. Put together, the method turns “we saw red light from Hokkaido” into an estimate that the red emission reached 490–800 km.[1]
There is still judgment involved. The authors are reconstructing five past events, not operating a live triangulation system with perfect coverage. But this is the right kind of citizen science: not a scrapbook beside the real data, and not enthusiasm asked to impersonate calibration. The photographs supply angles and timing that the professional instruments did not always have.
The Storms Were Moderate Only If You Watched the Wrong Part
Dst and SYM-H are useful indices, but they are summaries. They are not the magnetosphere itself. In these five events, the Dst values fell between −100 and −121 nT, a range that places them in moderate-storm territory.[1] If that is the only number a person reads, the towering red aurora looks like an outlier that needs a special excuse.
The ASYM-H index changes the mood of the result. Across all five events, ASYM-H was 1.3–2.0 times larger than the SYM-H peak amplitude.[1] That is not a cosmetic technicality. It means the storms were strongly asymmetric: the disturbance was unevenly distributed rather than neatly captured by the symmetric ring-current signal that SYM-H emphasizes.
This is where “moderate” becomes a risky word. It is not wrong as a description of the Dst or SYM-H reading. It is incomplete as a description of what observers and satellites were living through. A lopsided storm can underperform in a neat global index while still producing strong regional consequences.
The shared solar-wind feature was density. All five events had solar wind density above 30 particles per cubic centimeter, while the solar wind speed was not extreme, at 350–600 km/s.[1] Dynamic pressure alone did not explain the pattern as cleanly as the dense-wind condition did.[1]
The Density Effect, Step by Step
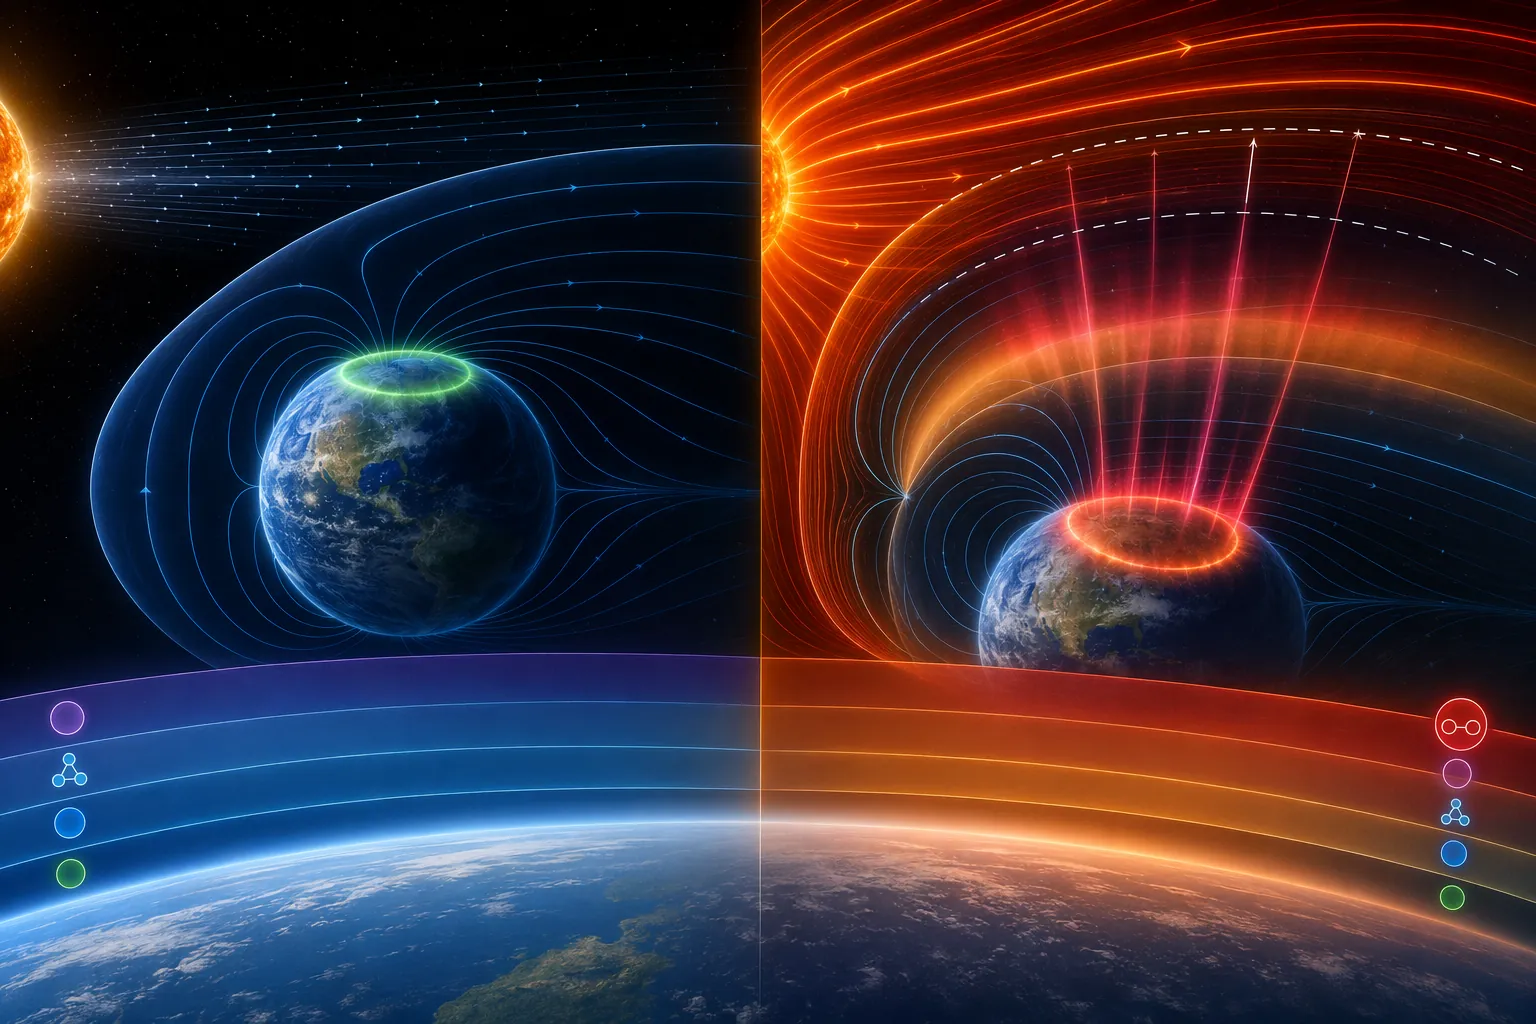
The proposed “density effect” is best read as a supported mechanism from this five-event set, not as a universal law. The sequence begins with dense solar wind pressing the magnetosphere inward. In these events, the magnetopause distance was estimated at only 5.9–7.1 Earth radii.[1]
Once compressed, the system does not merely draw a smaller boundary around Earth. The study argues that the dense solar wind heats and expands the upper thermosphere, while the auroral oval is pushed equatorward.[1] That combination gives red oxygen emissions a path to appear unusually high and unusually far south for storms that Dst would not advertise as severe.
- Dense solar wind exceeds 30 particles/cc.
- The magnetopause is compressed to roughly 5.9–7.1 Earth radii.
- The upper thermosphere heats and expands.
- The auroral oval shifts equatorward.
- Red 630 nm oxygen emission appears at 490–800 km over mid-latitude Japan.
The phrase “density effect” is doing real work here because it keeps the explanation from sliding into a simpler but weaker story about speed. Fast solar wind can certainly matter in other storms. In this set, however, the common condition was density above 30 particles/cc, not unusually high speed.[1] That is the kind of distinction that gets lost when aurora discussion is reduced to a single excitement meter.
Why This Matters Beyond a Pretty Red Horizon
For skywatchers, the finding is a warning against overconfidence, not a new promise. A dense-wind storm with a moderate Dst reading may still produce surprising red aurora, but local weather, moonlight, timing, haze, camera sensitivity, and the observer’s latitude still decide what a person actually sees. For practical forecast literacy, it is better to treat this as one more reason to read more than one signal; the aurora forecast resource guide is a useful place to compare those signals without pretending they remove uncertainty.
For satellite operators, the implication is sharper. The altitude band discussed in the study, 400–800 km, overlaps the region where atmospheric expansion can increase drag on low-Earth-orbit spacecraft.[1] If alerts lean too heavily on Dst thresholds, dense-wind storms may be treated as moderate while the upper atmosphere is more inflated than expected.
That does not mean this paper predicts a drag crisis from every dense solar-wind interval. It means the familiar index can miss the particular geometry and asymmetry that matter for some operational decisions. The broader technology context is covered in more detail in the guide to geomagnetic-storm effects; this study adds a narrower lesson about dense-wind storms, red aurora altitude, and underestimated thermospheric stress.
The Index Is a Tool, Not the Weather
There is a temptation to rescue every surprising aurora with a bigger adjective: monster storm, extreme event, historic sky. The numbers here argue for a quieter correction. Dst and SYM-H described one part of the disturbance, while ASYM-H, solar-wind density, magnetopause compression, satellite particle data, and ground photographs described other parts.[1]
The study’s strongest contribution is methodological as much as physical. It shows how a modest-looking storm record can be re-read when citizen photographs are treated as measurable observations, not as applause from the sidelines. It also shows why an index threshold that works reasonably well in many cases can become misleading when the storm is asymmetric and the solar wind is dense.
The careful conclusion is smaller than a headline and more useful than one. Nakayama and Kataoka do not make auroras predictable for an individual observer. They do show that “moderate” can be a misleading label when dense solar wind and storm asymmetry are involved. In those cases, a red aurora is not just a lovely anomaly on the horizon. It is evidence that the magnetosphere may have been under more stress than the headline index admitted.
References
- Extreme altitude of red aurora at mid-latitudes during moderate geomagnetic storms, Journal of Space Weather and Space Climate, 19 May 2026.
Related exhibits & inventory
Verified outcomes
No verified outcomes on file for this exam yet
See Methodology for how outcome evidence is disclosed once logged.
Planners
No planner filed for this exam yet
A downloadable timeline template for this exam hasn't been published yet.
Tool verdicts
AI-tool cautions
No AI tools tested for this exam yet
No hands-on AI-accuracy logs have been filed for this exam.
Questions about this plan
Ask a question about a specific section, timeline, or citation in this plan — or flag something that needs correcting.
Comments
Join the discussion with an anonymous comment.