
How Economics Students Can Track Consumer Sentiment
Learn how to find, access, and interpret consumer sentiment data using the Michigan Consumer Sentiment Index and Conference Board Consumer Confidence Index through free public sources like FRED. Understand the limitations of sentiment data, including the weakening link between consumer feelings and actual spending.
Updated:
Start with the number, not with a grand theory of “the mood of the consumer.” If you need a current example for a class paper, open FRED and search UMCSENT. That series is the University of Michigan Consumer Sentiment Index, and its May 2026 reading is 44.8, with the index benchmarked to 1966:Q1 = 100.[1] Before you write a sentence about whether consumers are “confident,” you should know which survey produced the number, what its base is, and whether you are comparing it with the right kind of series.
For most student work on U.S. consumer sentiment, two indexes do the main work: the Michigan Consumer Sentiment Index and the Conference Board Consumer Confidence Index. They are both survey-based, both widely cited, and both easy to misuse.
| Index | What to search or open | Survey design | Index base | Best first use |
|---|---|---|---|---|
| University of Michigan Consumer Sentiment Index | FRED series UMCSENT; University of Michigan Surveys of Consumers | Monthly survey of 500-1,000 households, with about 50 core questions | 1966:Q1 = 100 | Tracking household views of personal finances, business conditions, and buying conditions over time |
| Conference Board Consumer Confidence Index | Conference Board Consumer Confidence page; public data summaries and releases | Monthly survey of about 5,000 households, built around 5 questions | 1985 = 100 | Comparing present conditions and expectations in a separate, widely watched survey |
The Michigan survey is not just a line on a chart. It is a monthly household survey with 500 to 1,000 respondents and about 50 core questions.[2] The Conference Board’s index is not the same survey with a different label; it surveys about 5,000 households and uses five questions.[3] Those differences matter when you compare the indexes. A larger sample does not automatically make one index “better,” and a longer questionnaire does not automatically make one index “deeper” for every research question. It means you must describe the instrument you are using.
A Basic Tracking Routine
A workable routine is simple enough to repeat every month. The important part is not that you memorize release dates. The important part is that you stop treating a screenshot from social media as a data source.
- Identify the index by name. Write “University of Michigan Consumer Sentiment Index” or “Conference Board Consumer Confidence Index,” not just “consumer confidence.”
- Open the source. For Michigan, FRED’s UMCSENT page is the easiest classroom entry point; for the Conference Board, start with its consumer confidence page and releases.
- Check the base period. Michigan uses 1966:Q1 = 100; the Conference Board uses 1985 = 100. Do not compare index levels as if they share the same zero point or benchmark.
- Look at the trend, not only the latest value. Ask whether the latest reading is part of a several-month move, a reversal, or a noisy one-month change.
- Separate description from interpretation. “The index fell” is a data description. “Consumers will cut spending” is a behavioral claim that needs more evidence.
FRED is a good starting point because it removes one common barrier: access. You can graph UMCSENT, change the date range, download the data, and cite the series without needing a subscription.[1] That convenience is useful, especially in a first economics paper. It is not a substitute for reading what the series measures.
How to Read UMCSENT Without Overstating It
On FRED, the UMCSENT graph gives you the index level over time. The May 2026 value of 44.8 is low relative to the index’s own history, but the phrase “near historic lows” still needs to be handled carefully because the survey method changed recently.[1] The level is not a percentage of people who feel good. It is an index, normalized to a base period. If you write “sentiment was 44.8 percent,” you have already lost the plot.
A cleaner sentence for a student paper would be: “The University of Michigan Consumer Sentiment Index stood at 44.8 in May 2026, using a 1966:Q1 = 100 benchmark, indicating very weak sentiment relative to the series’ historical scale.” That sentence says what the number is, where it comes from, and what kind of comparison is being made. It does not pretend the index directly measures total spending, income, or GDP.
Why the Conference Board Index Is Not Interchangeable
The Conference Board Consumer Confidence Index is often mentioned in the same breath as Michigan sentiment, but the two should not be mashed into one generic “confidence” number. The Conference Board survey uses about 5,000 households and five questions, and its index is benchmarked to 1985 = 100.[3] That base alone is enough to make direct level comparisons with UMCSENT invalid.
A useful comparison asks whether the indexes are moving in the same direction, not whether one is “higher” than the other. If Michigan sentiment falls while Conference Board confidence is flat, that is not a mistake to average away. It is a clue to check survey wording, timing, respondent composition, and the split between current conditions and expectations.
| Bad comparison | Better comparison |
|---|---|
| “Michigan is at 44.8 and the Conference Board index is higher, so consumers are more confident in the Conference Board data.” | “The two indexes use different base periods and survey designs, so their levels should not be directly compared.” |
| “Consumer confidence fell, so spending must fall next month.” | “Sentiment weakened; whether spending follows requires separate evidence from consumption or retail data.” |
| “The latest reading proves households are irrational.” | “The reading shows weak reported sentiment; explaining why requires checking inflation perceptions, politics, income conditions, and actual spending behavior.” |
The 2024 Michigan Break Is Not a Footnote to Ignore
Here is the kind of detail that changes how you read a chart: the Chicago Fed found that the Michigan survey’s 2024 transition to web-based data collection introduced a downward measurement error of 25 to 30 index points.[4] That is not a tiny rounding issue. It means pre-2024 and post-2024 readings are not perfectly clean historical comparisons.
This does not mean UMCSENT is useless. It means your interpretation needs a warning label. If your paper compares 2019, 2022, and 2026 Michigan sentiment readings, you should tell the reader that the survey mode changed in 2024 and that Chicago Fed researchers estimated a sizable downward measurement effect from that transition.[4] Leaving that out makes the graph look more precise than the underlying measurement allows.
For coursework, the practical solution is usually enough: use UMCSENT, cite it properly, and add one sentence acknowledging the survey-mode complication when your time window crosses 2024. If your assignment is specifically about measurement, then the transition becomes central rather than incidental.
Sentiment Is Weaker as a Spending Signal Than It Used to Be
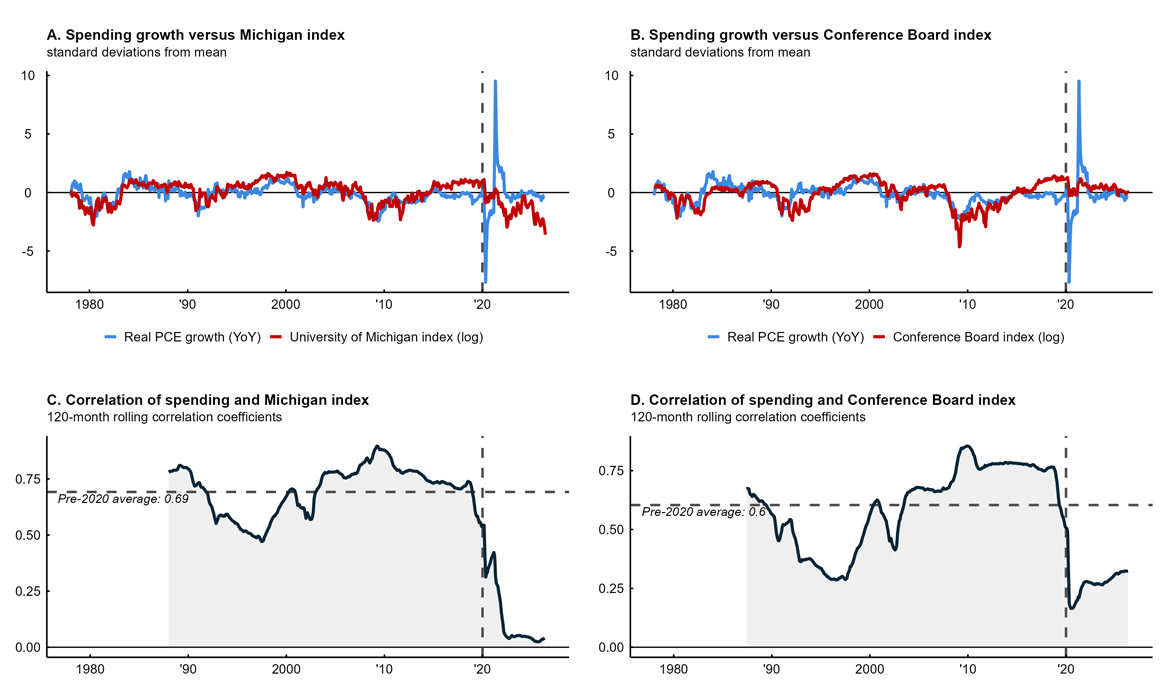
The most common beginner mistake is to move directly from a low sentiment number to a prediction of collapsing consumption. That move used to be more defensible than it is now, and even then it required care. The Kansas City Fed reports that before 2020, the 120-month rolling correlation between the Michigan Consumer Sentiment Index and real personal consumption expenditures growth averaged 0.69; since then, it has fallen near zero.[5]
That is a large change in the usefulness of the index as a simple spending signal. The same Kansas City Fed analysis finds that adding sentiment data to spending forecasts produces only modest improvements, with forecasts staying within 0.5 percentage points of models that do not include sentiment.[5] So the careful interpretation is not “sentiment tells us nothing.” It is that sentiment alone now adds limited forecasting power for spending.
Brookings gives another way to see the break. Before 2020, unemployment, inflation, consumption, and stock market performance explained 77.4% of the variation in sentiment in its analysis; after the pandemic, that relationship broke down.[6] This is exactly where an economics student should slow down. If the macro variables that used to explain sentiment stop doing so, the index may still be measuring real household responses, but the mapping between the index and standard macro conditions has changed.
Why People Can Feel Bad and Still Spend
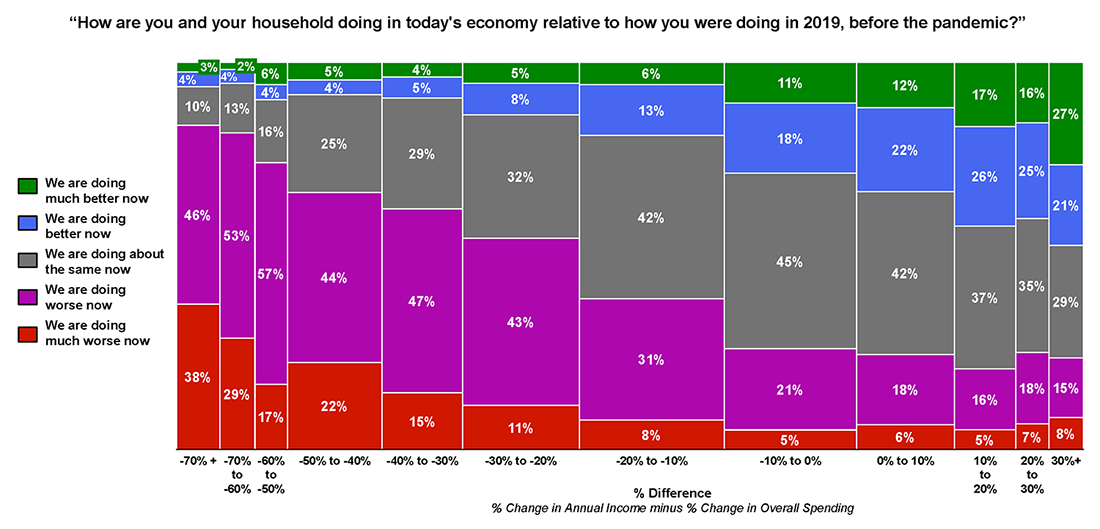
One reason the sentiment-spending link has become harder to read is that people answer surveys with memories, frustrations, and price perceptions that do not always line up with their current purchases. A Federal Reserve FEDS Notes analysis using Numerator-linked survey data in April 2025 found that 80% of consumers reported putting “a lot or some effort” into cutting expenses.[7] The same analysis found that 61.8% experienced 20-30% cumulative retail inflation between 2019 and 2024, while 24% overestimated inflation as more than 40%.[7]
That combination is awkward in the right way. Households can be trying to cut expenses, feeling squeezed by prices, misperceiving the exact size of inflation, and still making purchases. McKinsey reported in January 2025 that 53% of consumers described themselves as mixed or pessimistic while spending continued to grow.[8] The point is not that consumers are confused. The point is that a survey answer about conditions and an observed spending series are different kinds of evidence.
Politics Can Move the Survey Answer Too
Partisanship is not the whole story, but it is no longer safe to ignore it. Brookings reports an asymmetric partisan response pattern, with Republicans showing a 15-point partisan swing compared with 6 points for Democrats.[6] That matters most around elections and major political events, when short-term survey movements may partly reflect who feels better or worse about the political environment rather than only changes in income, jobs, or prices.
For a student paper, this does not require turning every sentiment paragraph into a political science essay. It requires a narrower claim. Instead of writing, “Consumers became more pessimistic because the economy worsened,” write something closer to: “The sentiment index fell, although recent research suggests post-2020 readings may reflect a weaker link to macro fundamentals and some partisan response bias.” That sentence is less dramatic and much harder to embarrass later.
What a Good Student Paragraph Looks Like
A strong paragraph does four jobs: it names the index, gives the source, describes the movement, and limits the interpretation. It does not need to sound like a forecaster’s note.
For example: “The University of Michigan Consumer Sentiment Index, available as FRED series UMCSENT, registered 44.8 in May 2026 on a 1966:Q1 = 100 basis.[1] This indicates very weak reported sentiment by the standards of the Michigan series. However, the reading should not be interpreted mechanically as a prediction of lower consumer spending, because recent evidence shows the historical relationship between Michigan sentiment and real consumption growth has weakened substantially since 2020.[5] In addition, comparisons across the 2024 survey transition require caution because researchers at the Chicago Fed estimate that the move to web-based collection introduced a downward measurement error of 25 to 30 index points.[4]”
That is not flashy. It is better than flashy. It tells the reader what was measured, where the number came from, why the number matters, and where the interpretation stops.
A Small Workflow You Can Reuse
| Research task | What to do | What to avoid |
|---|---|---|
| Need the latest Michigan sentiment number | Open FRED, search UMCSENT, record the latest value and date | Calling the index a percentage |
| Need to compare two confidence measures | Use Michigan and Conference Board separately, noting survey design and base period | Averaging the two levels or treating one as a corrected version of the other |
| Need to discuss spending | Bring in consumption, retail sales, or purchase evidence separately | Assuming low sentiment automatically means lower spending |
| Need a long historical chart | Check whether the time range crosses the 2024 Michigan survey transition | Ignoring the web-transition measurement issue |
| Need to explain a sharp short-term swing | Check macro conditions, inflation perceptions, and possible partisan response effects | Attributing the entire move to one economic cause |
If you are building broader habits around money, data, and economic decision-making, consumer sentiment is one good place to practice because it forces you to separate a public headline from an actual source. For a wider student-level foundation, the guide on how to build financial literacy as a student fits naturally after you learn how to read indexes like these.
The standard is modest but serious: pull the series yourself, name the institution, check the base period, notice the survey design, and write a claim that the data can actually support. Once you can do that with UMCSENT and the Conference Board index, you are no longer just repeating “consumer confidence is down.” You are doing the first layer of economic data work.
References
- University of Michigan: Consumer Sentiment, FRED, Federal Reserve Bank of St. Louis.
- Surveys of Consumers: Survey Description, University of Michigan Surveys of Consumers.
- Consumer Confidence, The Conference Board.
- Chicago Fed Letter No. 521, Federal Reserve Bank of Chicago, 2026.
- Forecasting with Feelings: The Modest Link between Consumer Sentiment and Spending, Federal Reserve Bank of Kansas City.
- The Paradox between the Macroeconomy and Household Sentiment, Brookings.
- Tracking Consumer Sentiment versus How Consumers Are Doing Based on Verified Retail Purchases, Federal Reserve FEDS Notes, April 24, 2025.
- The value-now consumer: Making sense of US consumer sentiment and spending, McKinsey, January 2025.
Comments
Join the discussion with an anonymous comment.