
The Desmos Decision Framework: Exactly When to Use Desmos and When to Solve by Hand on SAT Math
Learn a simple four-check framework to decide in seconds whether Desmos will save you time or slow you down on the digital SAT Math section, so you can avoid over-reliance and save up to 10 minutes across the test.
Updated:
You are on question 17. The equation looks graphable. Your cursor is already drifting toward the Desmos icon. But there is a little alarm bell too: if you type it wrong, zoom twice, trace the wrong point, and then wonder whether the decimal should be rounded, the calculator has not saved you time. It has borrowed time from the next question.
That is the real problem behind most digital SAT Desmos calculator tips. The issue is not whether Desmos is powerful. It is. The issue is whether you can decide, in about five seconds, whether this specific SAT Math question belongs in Desmos or on paper.
College Board makes the point more plainly than many students expect: its SAT calculator policy says “there are some questions where it's better not to use a calculator, even though you're allowed to.” [1] That caveat matters because the digital SAT Math section gives you 44 questions across two 35-minute adaptive modules, which works out to about 95 seconds per question. [2] A 60-second tool mistake is not a small preference. It is most of a question.
A useful framework does not make you anti-calculator. It makes you less automatic. Method Learning estimates that roughly one-third of digital SAT Math questions can be solved using Desmos alone, based on early practice-test analysis. [3] Some informal online claims run much higher, but College Board does not publish an official percentage. So the safest conclusion is narrower: Desmos is a major advantage on a meaningful slice of the test, not a universal first move.
PrepMaven describes one student who raised their math score by over 100 points after improving their Desmos strategy. [4] That is encouraging, but it is still one tutoring-company case, not a promise. The lesson is not “Desmos adds 100 points.” The lesson is that tool choice is a skill, and students in the 500–700 range often have more points available in decision-making than they realize.
The Five-Second Desmos Decision
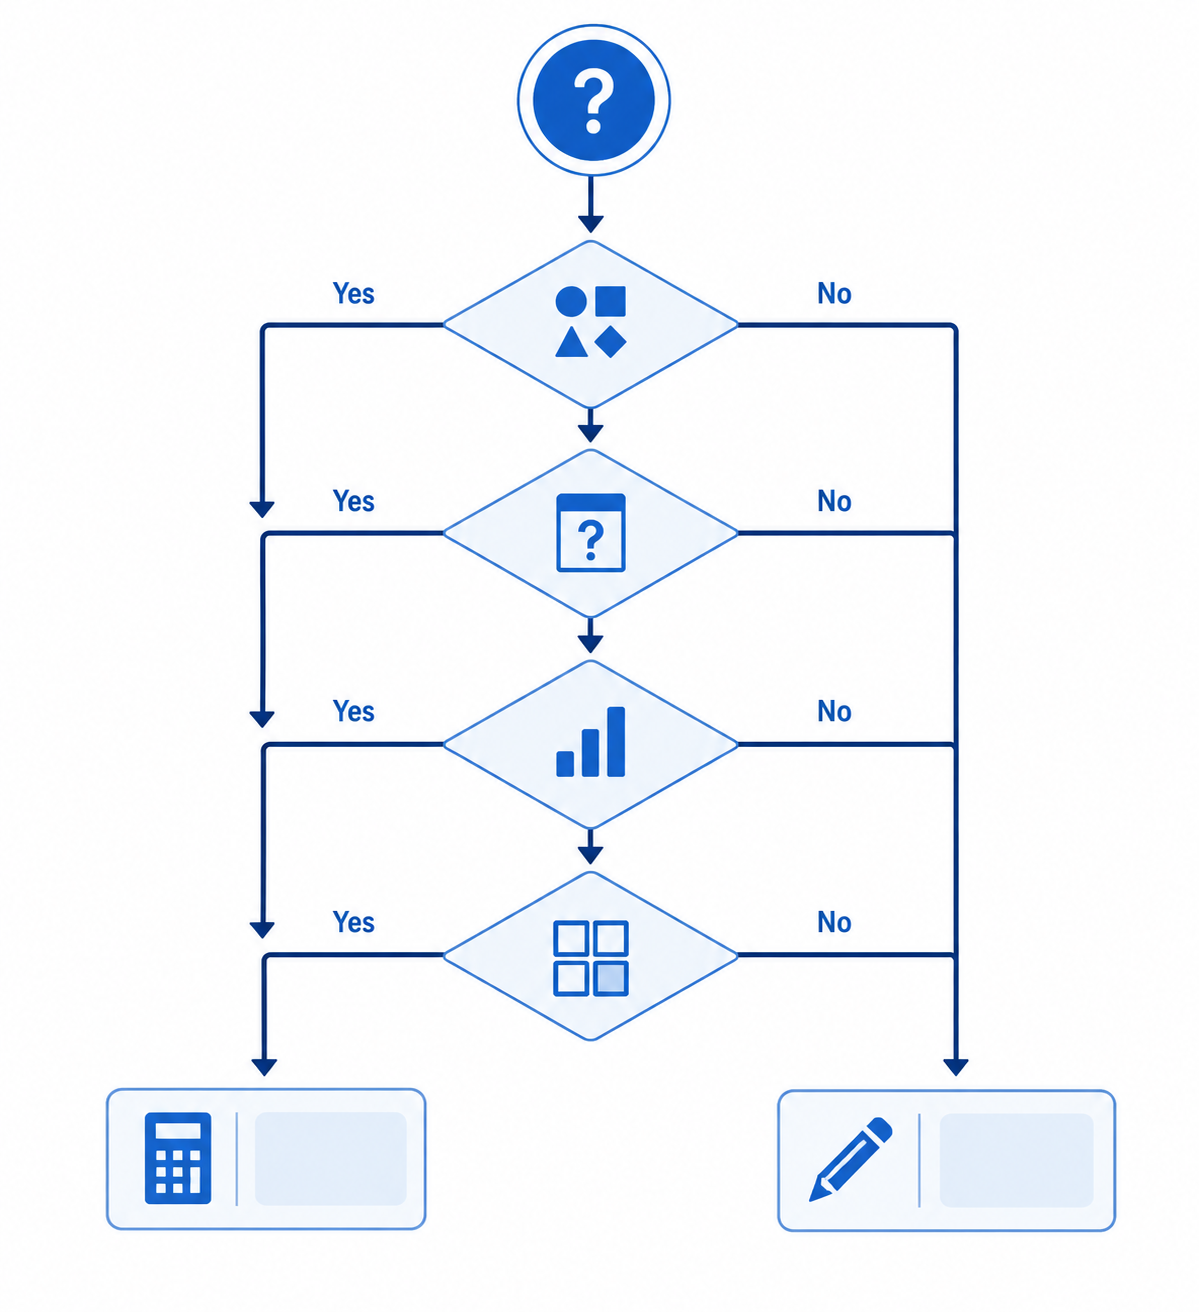
Before touching the calculator, run four checks. You are not solving yet. You are deciding where the solution should happen.
| Check | Ask yourself | Usually faster |
|---|---|---|
| Problem type | Is this asking for an intersection, vertex, intercept, function value, statistic, regression, or slider-friendly constant? | Desmos |
| Answer form | Are the answer choices clean integers, simple fractions, or readable coordinates? | Desmos |
| Constant complexity | Is this really a slope, parallel-line, discriminant, factoring, or equivalent-expression problem hiding behind a graphable surface? | Hand-solving first |
| Module position | Am I late in a harder Module 2, where the question may be built to punish obvious graphing? | Algebra first, Desmos as backup |
The point of the framework is speed, not elegance. If a system of equations will show a clean intersection after two lines are entered, use Desmos. If a question asks which expression is equivalent to another, and factoring the common term takes one line, do that. If you are not sure after five seconds, choose the method that gives you the clearest first step, not the method that feels emotionally safer.
Strategic Test Prep describes top scorers as using “Desmos, algebra, and patterns,” rather than leaning on one approach for every problem. [5] That is the right model for a timed section.
When Desmos Owns the Question
There are SAT Math questions where hesitation is the mistake. If the structure says “graph me,” graph it. Desmos is especially strong when the question asks you to locate, compare, or evaluate something that the calculator can display directly.
- Systems with clean solutions: enter both equations and read the intersection, especially when the answer choices are simple ordered pairs.
- Intercepts and vertices: graph the function and inspect the key point instead of expanding, completing the square, or solving from scratch.
- Function evaluation: define the function once, then plug in the requested input cleanly.
- Statistics from a data list: use built-in tools for mean, median, standard deviation, and range when the arithmetic would be slow or error-prone.
- Regressions from tables: use the tilde regression feature when the task is to model data from a table.
- Unknown constants: use sliders when the question is clearly asking which value makes a graph, intersection, or condition work.
SupertutorTV and PrepMaven both highlight Desmos-friendly categories such as systems, function behavior, and strategic use of graphing features on the digital SAT. [6][4] These are the moments when “use Desmos” should be a confident decision, not a guilty shortcut.
Take a clean system as a typical example. If the answer choices are four coordinate pairs and both equations are already in graphable form, hand-solving may still work, but it asks you to spend time on substitution or elimination. Desmos can give you the intersection directly. Your job is then to check that the displayed point matches one of the answer choices, not to admire the graph.
The same applies to a quadratic asking for a minimum value or x-intercepts. If the graph window shows the relevant feature clearly and the answer form is clean, the calculator is doing exactly what it is built to do. The only students who lose time here are the ones who keep adjusting the window after the answer is already visible.
Use Desmos Aggressively, Then Stop Looking
A good Desmos solution has an exit condition. You are looking for a point, value, parameter, or pattern. Once you have it, leave. The glazed-over version of calculator use usually begins after the answer has appeared: zooming again, dragging again, typing a second version of the same equation, or checking a decimal that was never meant to be exact.
For students building a full SAT plan around this, the broader SAT Exam Prep Guide is the better place to organize reading, grammar, math content, and practice tests. This framework is narrower: it is for the exact second when you decide whether the calculator gets the problem.
When Desmos Starts Eating the Clock
The dangerous questions are not always the ones that look impossible. They are often the ones that look just graphable enough to tempt you. You open Desmos, enter an equation, see something plausible, and then realize the question is not actually asking for the thing the graph gives easily.
SupertutorTV identifies several categories where Desmos can become slower, including parallel-line constant problems, ugly-fraction systems, and discriminant-style questions. [6] SayHelloCollege also gives examples of digital SAT problems where manual solving can outperform calculator work. [7] The overlap is worth noticing: these are not anti-Desmos warnings. They are warnings about disguised algebra.
Parallel Lines and Same-Slope Constants
If a problem asks for a constant that makes two lines parallel, perpendicular, or gives a system no solution, pause before graphing. The answer often lives in the slope. Graphing can show two lines that look parallel, but the SAT is not asking whether your screen looks convincing. It is asking for an exact condition.
A hand solution may take only one comparison: put both lines into slope-intercept form, match the slopes, and solve for the constant. Desmos can still verify the result afterward, but using it first may send you into window adjustments and visual guessing when the algebra is cleaner.
Ugly Fractions, Radicals, and Decimal Fog
Answer form is one of the best early warnings. If the choices contain expressions with radicals, long fractions, or exact forms that do not resemble clean decimals, be careful. Desmos may show an approximation, but the answer choices may demand exact recognition.
This is where students waste surprising amounts of time. They get 1.414 on the screen, then scan for square root expressions. They get 0.333333, then wonder which fraction the test writer intended. Sometimes that is fine. But if the question can be simplified symbolically in fewer steps, paper is not old-fashioned; it is faster.
Discriminants and Hidden Conditions
Questions about how many solutions a quadratic has often come down to the discriminant, b² − 4ac. If the SAT asks which value of a constant gives one real solution, no real solutions, or two real solutions, graphing can help you visualize the situation, but the condition itself is algebraic.
For one real solution, set the discriminant equal to zero. For no real solutions, think about the discriminant being negative. Desmos can confirm the shape afterward, but it may be a slow first move if you are dragging a slider and trying to decide when a curve “just touches” the x-axis.
Equivalent Expressions
Equivalent-expression questions are another common trap. Yes, you can graph two expressions and see whether they overlap. You can also plug in values. But if the structure is a common factor, difference of squares, exponent rule, or distribution problem, the clean move is usually manipulation.
The calculator becomes especially clumsy when all four answer choices are algebraically close. You may spend more time entering options than you would have spent factoring the original expression.
The Module 2 Vortex Is Real, but It Is Not a Law
Late in a harder Module 2, reflexive graphing becomes riskier. SupertutorTV describes the danger of getting pulled into a “vortex into the abyss of Desmos” on certain harder questions. [6] That phrase is funny because it is recognizable: the student is busy the whole time, but the work is not converging.
Use module position as a caution light, not a rule. The last four or five questions of Module 2 are not guaranteed to be Desmos traps, and Bluebook’s adaptive ordering can vary. But if you are late in the module and the question involves a constant, exact expression, hidden condition, or unusually ugly answer form, try to see the algebraic relationship before opening the graph.
A good late-module habit is to spend the first five seconds naming the question. “This is a slope condition.” “This is a discriminant condition.” “This is a vertex I can read.” “This is just factoring.” Naming the job often reveals the tool.
A Practical Rule for the 500–700 Scorer
If you currently use Desmos because it feels safer than algebra, do not try to become a hand-solving purist overnight. That will only make you slower. Instead, sort your practice questions into three bins.
- Desmos first: clean systems, graph features, function values, statistics, regressions, and slider-friendly constants.
- Algebra first: parallel-line constants, discriminants, equivalent expressions, exact radical or fraction answers, and simple factoring.
- Hybrid: problems where Desmos gives a fast estimate, but algebra is needed to confirm the exact answer.
The hybrid bin is important. Many students hear “don’t overuse Desmos” as “avoid Desmos on hard questions.” That is too blunt. Sometimes the best path is to use Desmos to locate the answer, then use algebra to prove the exact form. Sometimes it is the reverse: solve by hand, then use Desmos to catch a sign error.
The estimated time savings from this kind of switching can be meaningful, but it should be treated as an estimate, not a guarantee. A student who avoids several 60- to 90-second calculator detours across 44 questions could plausibly save 5–10 minutes. The exact gain depends on current habits, accuracy, and how often the student was choosing the slower tool in the first place.
Small Desmos Habits That Matter After the Decision Is Made
Shortcut advice only helps after the framework has already said yes. If the problem belongs in Desmos, then efficiency matters: type cleanly, define functions when repeated evaluation is needed, use tables for data, and learn the shortcuts that reduce cursor fiddling. Mindfish’s Desmos tips include practical keyboard and calculator-efficiency details for students trying to move faster inside the tool. [8]
But shortcuts do not rescue the wrong decision. A fast typist can still waste time graphing a problem that wanted one slope comparison. A slow typist can still beat the clock by recognizing that a vertex question belongs in Desmos immediately.
How to Drill the Framework
Do not practice this only by solving. Practice the decision separately. Take a set of SAT Math questions and give yourself five seconds per question to label the first move: Desmos, algebra, or hybrid. Then solve and check whether the label was right.
After each timed set, review misses in two ways. First, ask whether the math was wrong. Second, ask whether the tool choice was wrong. Those are different errors. A student can understand the content and still lose time by entering four answer choices into Desmos when factoring would have taken one line.
For a structured way to build this into weekly prep, use the Digital SAT Practice Schedule 2026. The key is to drill the decision under time pressure, because a framework you can explain slowly is not the same as a framework you can use in Bluebook.
The fastest SAT Math students are not calculator loyalists or algebra loyalists. They are switchers. They know when Desmos should take the problem, when paper should take it, and when one should check the other. That judgment is not magic. It is a habit built one five-second decision at a time.
References
- SAT Calculator Policy, College Board
- 9 SAT Math Tips, MentoMind
- The Power of Desmos on the Digital SAT Math Section, Method Learning
- Desmos on the Digital SAT, PrepMaven
- 6 Desmos Hacks to Boost Your SAT Math Score, Strategic Test Prep
- When Not to Use Desmos on the Digital SAT, SupertutorTV
- Guide to Using the Desmos SAT Calculator, SayHelloCollege
- SAT Desmos Series Part 0: Tips & Tricks, Mindfish
Comments
Join the discussion with an anonymous comment.