
66% of US Households Have Cut the Cord: 2026 Statistics
A comprehensive look at the latest 2026 cord cutting data: how many households have cut the cord, how TV viewing has shifted to streaming, what it costs, and which demographics still subscribe to traditional pay-TV.
Updated:
The cleanest 2026 cord cutting statistic is also the one most likely to be misread: about 66% of U.S. households are now without traditional pay-TV, based on late-2025 Leichtman Research Group data cited by Adwave.[1] That makes cord cutting the majority condition, not the fringe behavior it was when canceling cable still felt like a household experiment.
But “without traditional pay-TV” is not the same as “spending less,” “watching less television,” or “living outside the bundle.” In 2026, the more useful question is not whether cord cutting happened. It is what replaced cable after streaming became the default way many households assemble television.
Traditional Pay-TV Is No Longer the Default
The long-term subscriber line is the simplest way to see the shift. Traditional pay-TV peaked around 100 million U.S. subscribers in 2012; by 2026, the market is down to roughly 55 million to 60 million subscribers.[2] That is not a small preference change inside the same market. It is a structural decline in the household product that used to sit at the center of television access.
The 66% figure matters because it converts that decline into a household reality. Most U.S. households no longer buy the old cable or satellite package. For students or researchers looking for one headline number, that is the one to start with. For anyone comparing bills, it is only the first line of the spreadsheet.
| Metric | 2026 Data Point | What It Measures |
|---|---|---|
| Households without traditional pay-TV | About 66% | Household subscription status, not viewing time |
| Traditional pay-TV subscribers | Roughly 55 million to 60 million | Subscriber base after decline from the 2012 peak |
| Streaming share of TV viewing | 47.5% | Time spent watching TV, not household subscription penetration |
| Cable share of TV viewing | About 20% | Viewing time still held by cable networks |
Those categories should not be blended together. A household can cancel cable and still watch hours of television through streaming apps. Another household can keep cable mainly for sports and still watch Netflix, YouTube, or other streaming services most nights. Cord cutting describes a subscription decision. It does not, by itself, describe total TV consumption.
Viewing Time Has Moved Even Faster Than the Bill
Pew Research Center found that 83% of U.S. adults watch streaming TV, and the broader streaming-service reach is even higher when measured as use of at least one service.[3] That helps explain why a household can be “cord-cut” without feeling especially unconventional. Streaming is no longer a substitute that needs explaining; cable is increasingly the subscription that needs a reason to stay.
Nielsen’s viewing data points in the same direction from a different angle. In The Gauge for December 2025, streaming reached a record 47.5% of total U.S. TV viewing time, compared with cable at about 20%.[4] That is a viewing-share statistic, not a subscription statistic, but the two lines reinforce each other: fewer households subscribe to traditional pay-TV, and more actual TV time is flowing through streaming services.
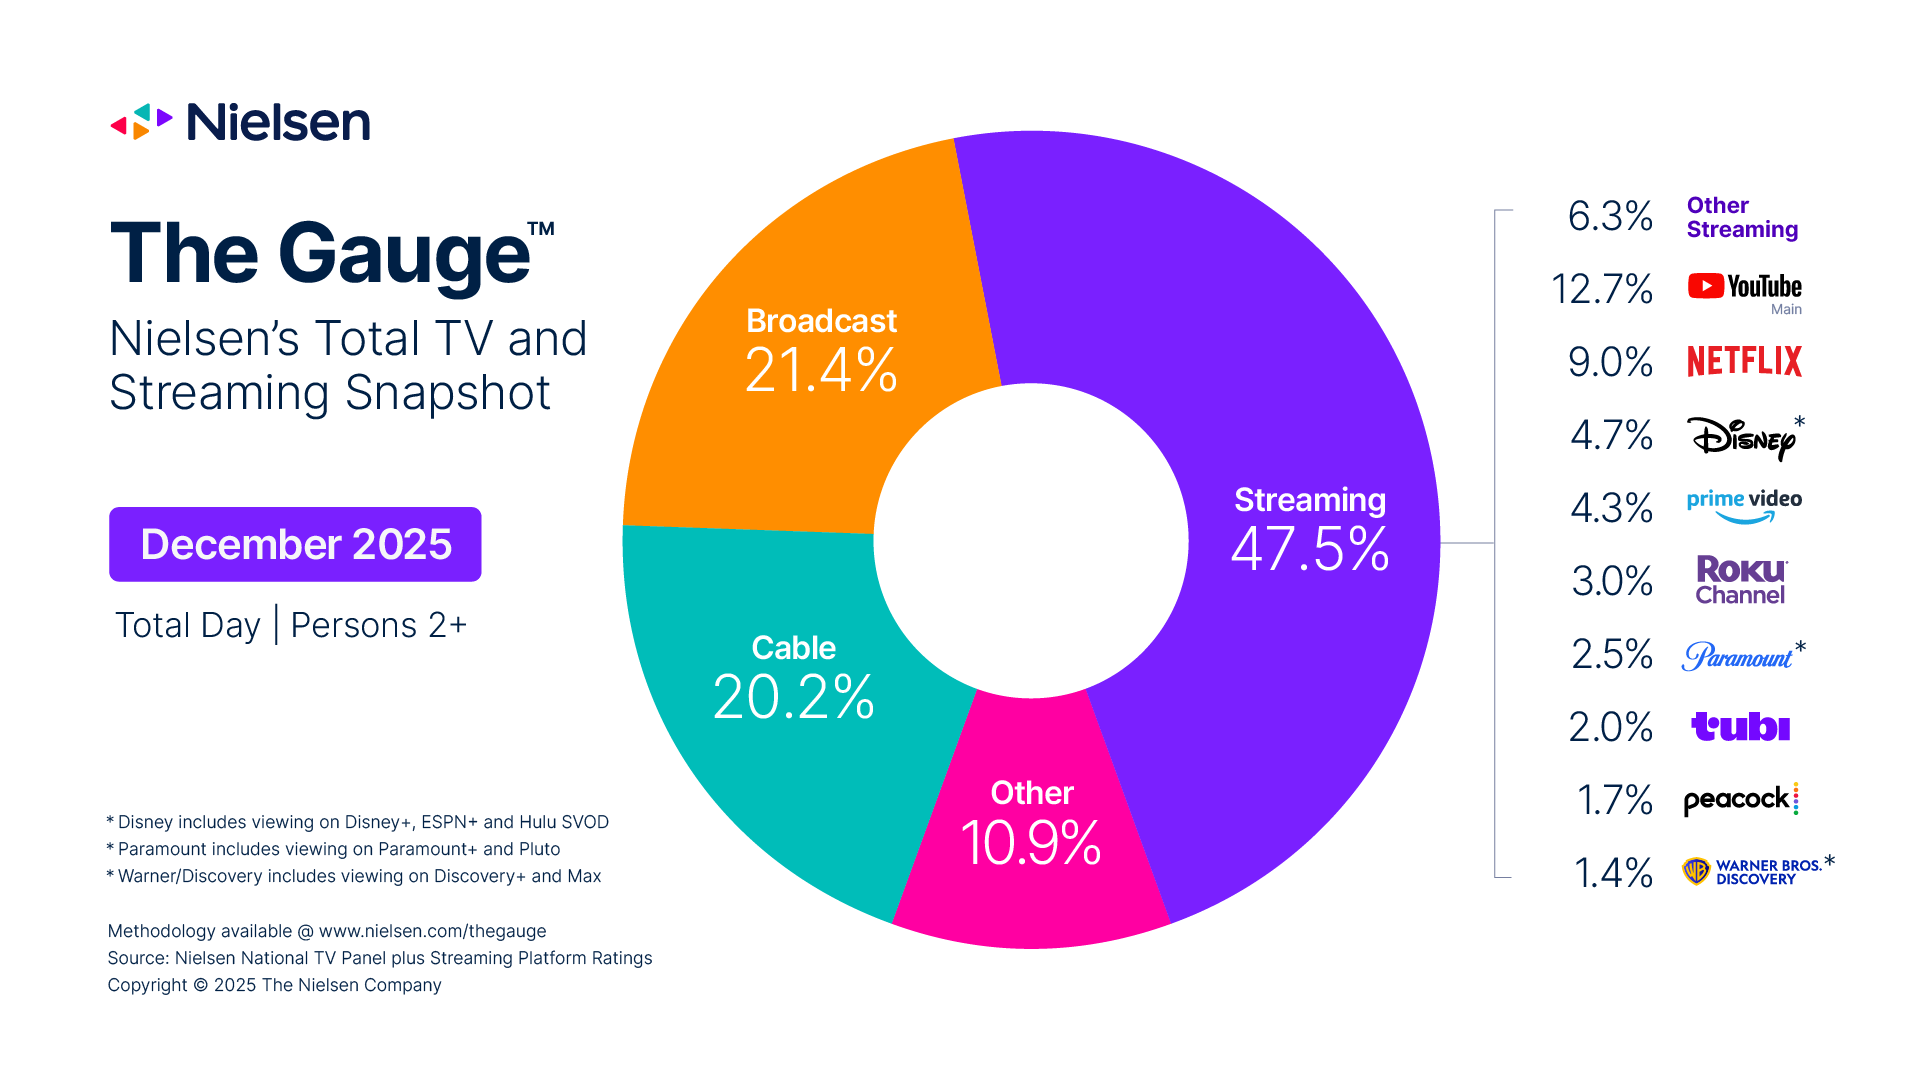
This is where “cable is dead” still overstates the case. A 20% viewing share is not dominance, but it is also not disappearance. Cable has moved from being the default layer of television to being one source among several, with its strength concentrated in certain kinds of programming and certain households.
The Savings Story Has Gotten Harder to Defend
Early cord cutting was easy to explain as a price decision: cancel the expensive bundle, keep broadband, add a cheaper streaming service or two. The 2026 bill comparison is less tidy. CableCompare places advertised cable pricing around $90 to $110 per month before fees, while actual cable bills commonly land closer to $115 to $150 once fees and equipment charges are included.[2]
A full streaming stack can now reach the same neighborhood. CableCompare estimates that a cable-like streaming bundle can cost about $150 to $165 per month when households combine multiple major streaming services, live TV streaming, and sports or premium add-ons.[5] That does not mean every cord-cutter pays that much. A household that rotates subscriptions, watches mostly free ad-supported services, or skips live sports can still spend far less. But the automatic-savings claim no longer works for the household trying to recreate the old bundle piece by piece.
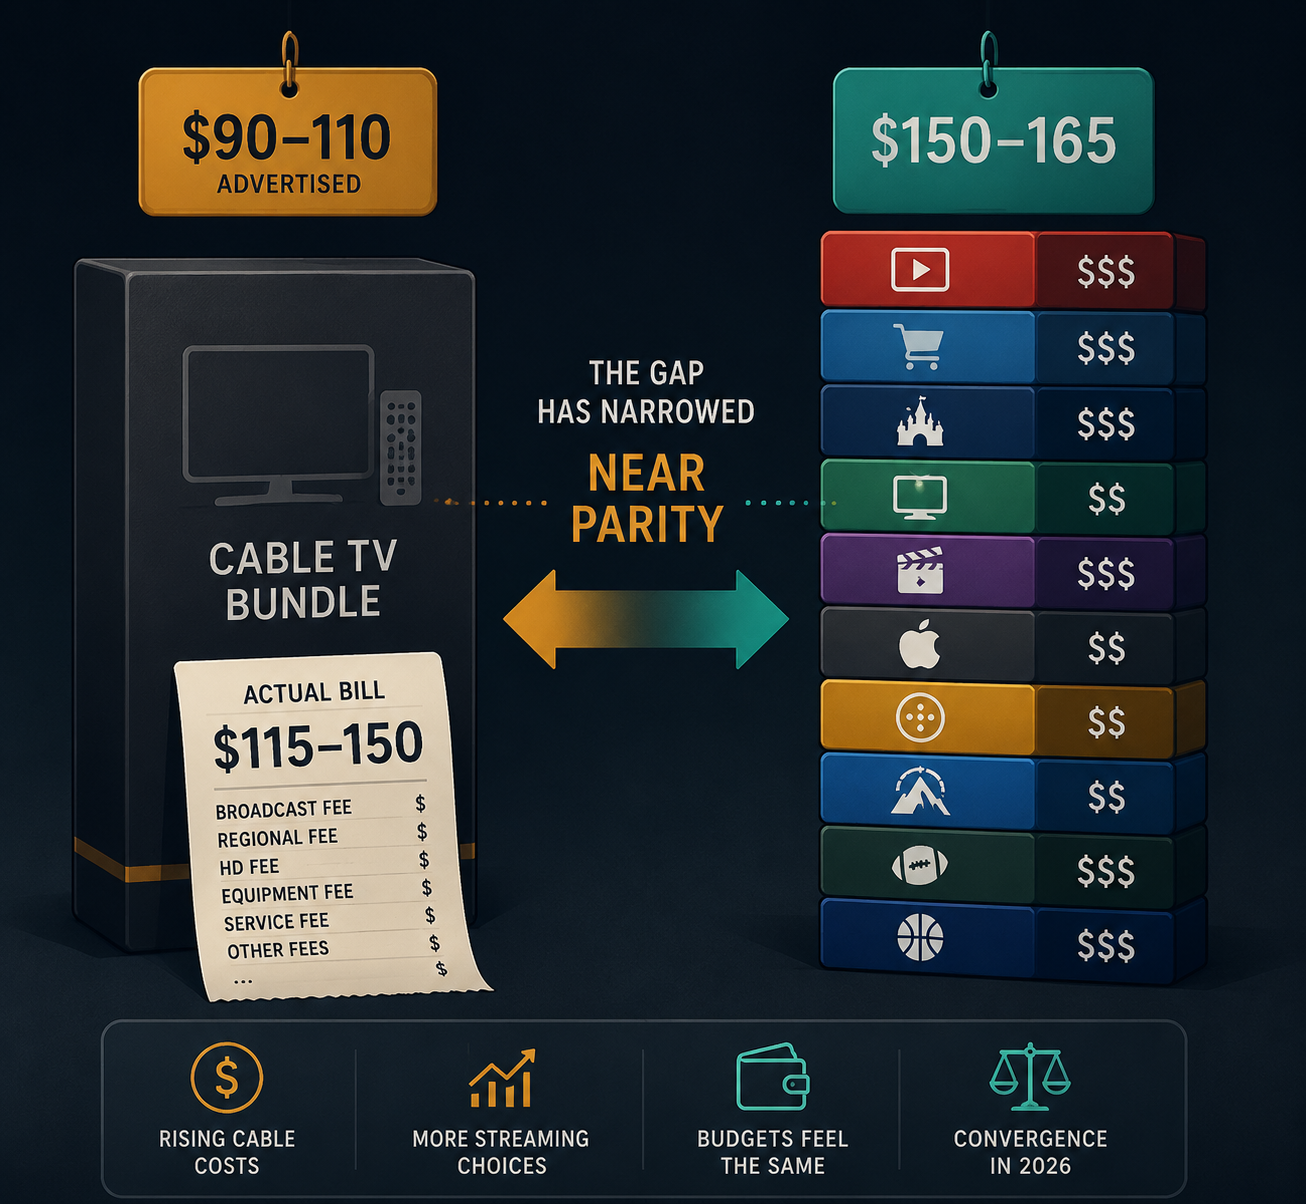
That cost convergence changes the meaning of cord cutting. The decision is less often a clean break from bundles and more often a decision about which bundle is tolerable: the traditional cable bill with fees and channel packages, or the streaming pile with separate apps, changing prices, password rules, ads, and rotating content libraries.
Some Cord-Cutters Have Gone Back
The clearest behavioral warning sign for the simple migration story is the returner statistic. A Coupon Cabin study reported by Fortune found that 22% of cord-cutters had returned to cable as streaming service prices increased.[6] That should not be treated as proof that cable is recovering broadly. It does show that the replacement system has become frustrating enough for a meaningful share of former cable customers to reconsider the old product.
The overlap between cable and streaming also matters. CableTV.com reported that 82% of cable customers also pay for streaming.[7] In practice, many households have not chosen one system over the other. They have kept cable for channels, sports, household habit, or bundled service discounts, while adding streaming for original shows, on-demand viewing, or platforms other people in the house expect to have.
For household budgeting, this overlap is the expensive middle: paying for the legacy bundle and then rebuilding the new one on top of it. It also explains why viewing-share data can move faster than subscriber data. A cable household may still spend most of its entertainment time inside streaming apps.
Age Is the Sharpest Demographic Split
The strongest demographic divide in the available 2026 picture is age. Pew found that 64% of adults ages 65 and older subscribe to cable or satellite, compared with 16% of adults ages 18 to 29.[3] That gap is large enough to explain why cable can feel both obsolete and persistent depending on whose living room is being described.
For younger adults, cable is often not the service they are leaving; it is the service they never formed a habit around. For many older adults, the value of cable may include familiar navigation, local channels, customer service expectations, or a single bill. Those are not glamorous advantages, but they affect actual adoption.
This is also why household-level cord cutting can lag cultural perception. A college student, renter, or young worker may see cable as functionally absent from daily life. A retired household may still treat it as the most reliable route to familiar programming. Both impressions can be true within the same national market.
Live Sports Keep Cable Relevant
Cable’s remaining leverage is not spread evenly across all television. It is concentrated in programming that is live, time-sensitive, and difficult to replace with a delayed library. Sports sit at the center of that leverage.
The scale of rights deals shows why. NFL media rights are valued at about $110 billion, and NBA rights at about $76 billion.[5] Those numbers are not household subscription counts, but they show where distributors, networks, and platforms still see must-have content. When a household keeps cable or a live TV streaming package for a season, playoffs, regional sports, or channel access, it is often responding to that rights structure rather than to affection for the cable bundle itself.
Streaming has gained sports rights too, which makes the consumer problem more complicated rather than simpler. A fan may need a traditional cable package, a virtual live TV service, and one or more standalone streaming subscriptions depending on the league, team, and event. The old bundle was expensive because it aggregated too much. The new sports map can be expensive because it fragments too much.
What Counts as Cord Cutting Depends on the Counter
The main trend is not in doubt, but the exact percentage can move depending on methodology. Pay-TV penetration estimates can vary by roughly 2 to 5 percentage points across sources because firms differ in which providers they track and how they classify services.[1][8] Leichtman-style provider tracking, eMarketer household estimates, and broader market counts are trying to describe the same shift from slightly different measurement angles.
The biggest classification headache is the virtual multichannel video programming distributor, or vMVPD: services such as YouTube TV, Hulu + Live TV, and Sling. Some analyses treat them as pay-TV because they sell live channel bundles. Others place them under streaming because they are app-based and delivered over the internet. A household using one of these services has cut the cable wire, but may still be buying a cable-like bundle.
That is why the phrase “traditional pay-TV” does real work. It usually points to cable, satellite, and telecom TV subscriptions rather than every possible live-channel package. When comparing cord cutting statistics, the first question should be whether the source includes or excludes vMVPDs. Without that detail, two numbers that look contradictory may simply be counting different products.
The 2026 Reading
The most defensible 2026 interpretation is measured but not neutral. Traditional pay-TV has lost its default household position. Streaming has won the largest share of TV viewing time. Younger adults are far less attached to cable than older adults. Those are not marginal changes.
At the same time, the consumer bargain has become messier. A household can cut the cord and still rebuild a bill that looks uncomfortably close to cable. A sports fan can leave the cable box and still need a live bundle. A cable subscriber can keep cable and still pay for several streaming services. The market has shifted, but the easy savings story has faded.
So the useful 2026 conclusion is not that cable is dead or that streaming failed. It is that cord cutting has matured. The majority of households have moved beyond traditional pay-TV, but the replacement system now carries enough cost, complexity, and live-programming friction to deserve its own scrutiny.
References
- How Many Americans Have Cut the Cord? (Q1 2026) — Adwave
- U.S. Cable TV Subscribers 2026: Ongoing Decline & Cord-Cutting Trends — CableCompare
- 83% of US Adults Watch Streaming TV, Far Fewer Subscribe to Cable or Satellite — Pew Research Center, July 1, 2025
- The Gauge December 2025 — Nielsen
- Streaming vs. Cable in 2026 — CableCompare
- Cable Cord-Cutters Are Returning as Streaming Service Prices Increase — Fortune, March 31, 2025
- 2026 Cable & Streaming Industry Report — CableTV.com
- Less Than 50% of US Households Now Subscribe to Pay TV — EMARKETER
Comments
Join the discussion with an anonymous comment.