
ACT Exam Hub
Practice ACT Science With Curiosity Rover Polygons
Three exam-style ACT Science passages built from real Curiosity Rover polygon data, with an annotated answer key that shows exactly what each question rewards. The drill trains the figure-reading and experimental-reasoning skills the test measures — no Mars background required.
- gre
- mcat
- asvab
- sat
- act
- digital-adaptive
- official-material
- section-strategy
- test-date-timeline
This is an ACT Science-style drill built from real Curiosity rover polygon evidence. It is not an astronomy quiz. The official ACT Science page lists 40 questions in 35 minutes and describes the section as testing interpretation, analysis, evaluation, reasoning, and problem solving rather than memorized science facts; newer prep coverage of the enhanced optional Science format reports 40 questions in 40 minutes, so check the format used for your test date instead of assuming one timing rule applies everywhere.[1][2]
The three passages below use the familiar ACT Science families: Data Representation, Research Summaries, and Conflicting Viewpoints.[2] If you want the science story first, use the companion guide, Curiosity Mars polygon features. If you want the test skill, start here: read the figure, read the table, and do not add Mars facts that the question did not ask for.
Practice set: Curiosity rover polygons
These passages and questions were created for practice. The measurements and observations used in the stimuli come from the cited Curiosity sources.
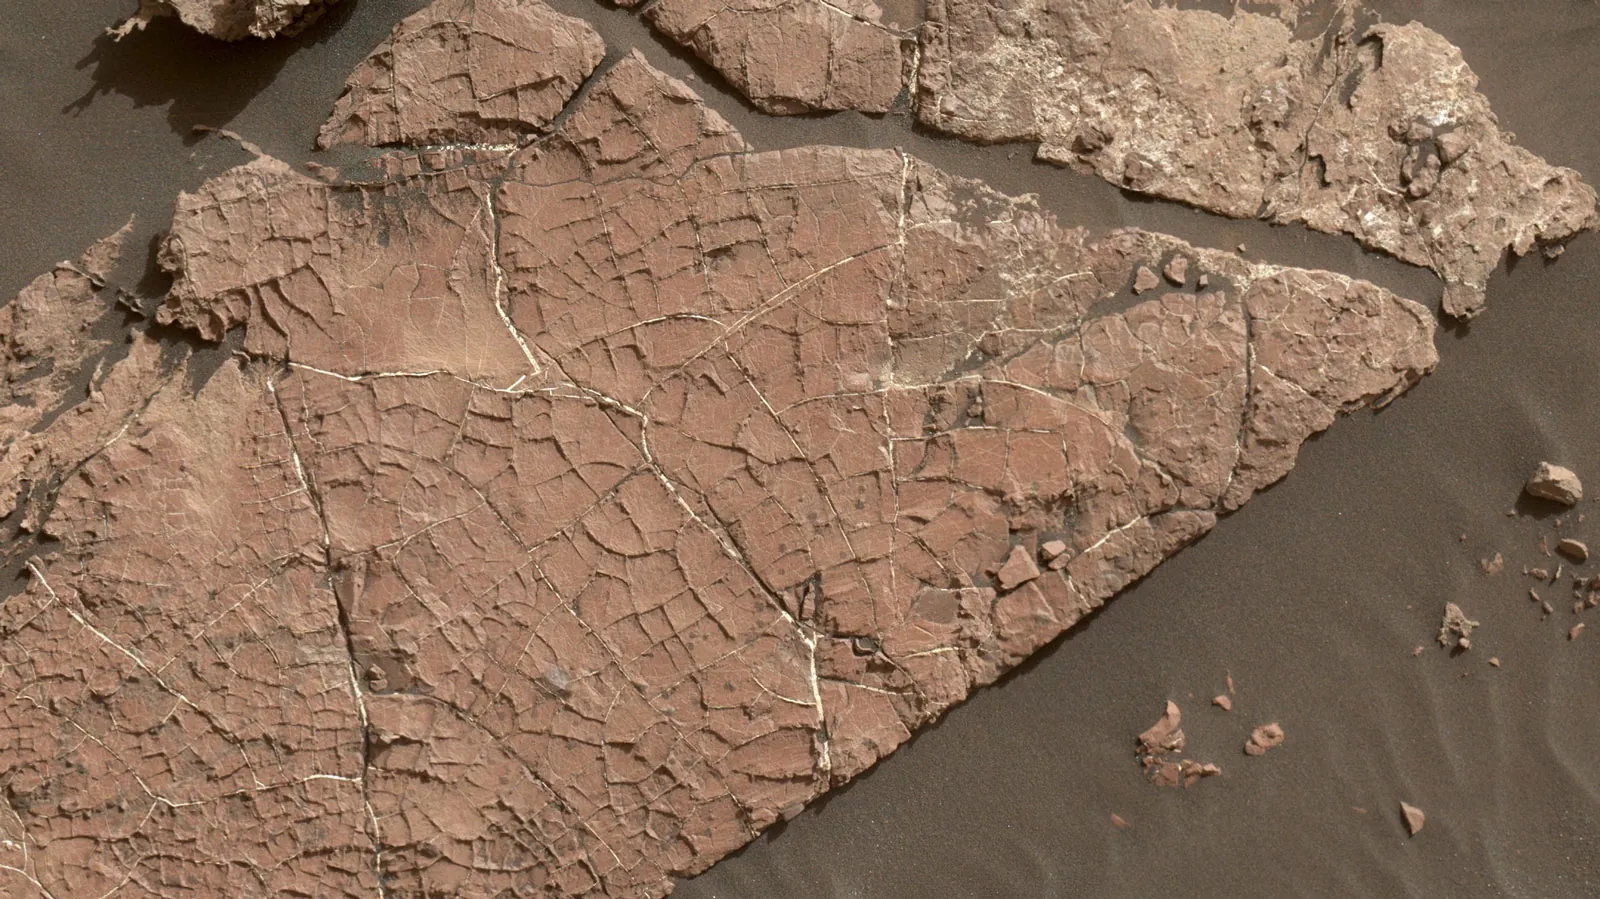
Passage 1 — Data Representation
Curiosity photographed several Martian rock surfaces divided into polygon-shaped cells. Table 1 summarizes three polygon fields using only values reported in accessible mission or science coverage. Old Soaker was described by JPL as a possible mud-crack site in 2017.[3] Pontours contained small hexagons that averaged about 4 cm across and ranged from about 1 cm to 7 cm across.[4] Valle Grande was reported by NASA in 2026 as a field of honeycomb-like polygons about 1.5–3 inches, or about 4–8 cm, across; NASA also stated that scientists were still measuring the polygons to determine which process formed them.[5]
| Curiosity site | Pattern described in source | Reported size information used in this passage | Mechanism status in source |
|---|---|---|---|
| Old Soaker | Angular polygons interpreted as possible mud cracks | No polygon-size value used here | Possible mud cracks |
| Pontours | Hexagonal, honeycomb-like polygons | Average about 4 cm across; range about 1–7 cm | Interpreted in later coverage as evidence linked to repeated wet-dry cycling |
| Valle Grande | Honeycomb-like polygon field | About 4–8 cm across | Formation process explicitly still under investigation |
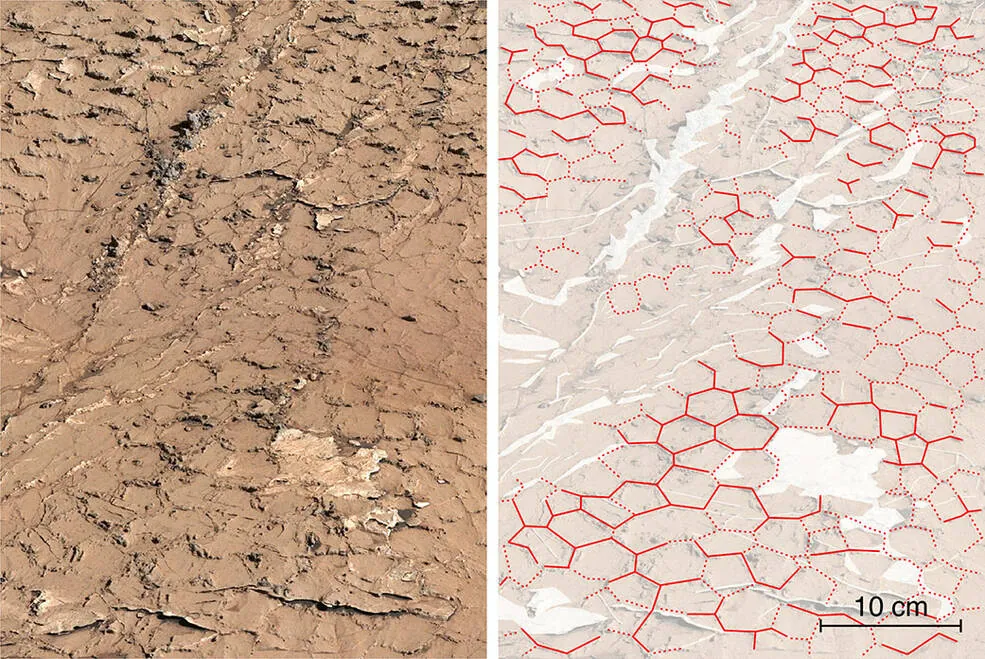
Use Table 1 to answer Questions 1–4.
- What is the width of the reported Pontours polygon-size range? A. 3 cm B. 4 cm C. 6 cm D. 7 cm
- Which value is closest to the reported average width of Pontours hexagons? A. 1 cm B. 4 cm C. 7 cm D. 8 cm
- Which comparison is supported by Table 1? A. The Pontours and Valle Grande ranges overlap from about 4 cm to 7 cm. B. All Pontours polygons are larger than all Valle Grande polygons. C. Valle Grande polygons have a smaller reported minimum than Pontours polygons. D. Old Soaker polygons have the largest reported average size.
- A student concludes, “Valle Grande must have formed by the same process as Pontours because the reported size ranges overlap.” Which response best evaluates that conclusion? A. Supported, because overlapping size ranges prove identical formation processes. B. Supported, because Curiosity found both sites on Mars. C. Not supported, because Table 1 says Valle Grande’s formation process is still under investigation. D. Not supported, because Pontours has no reported polygon-size measurements.
Passage 2 — Research Summaries
Scientists studying mud-crack patterns distinguish between a surface that dries once and a surface that experiences repeated wet-dry cycles. In Curiosity coverage, Old Soaker-style cracks are associated with T-shaped junctions near 90° and four- or five-sided polygons, while Pontours-style patterns are associated with Y-shaped junctions near 120° and hexagons.[6][7] Physics Today and experimental work on repeated drying cycles describe how crack patterns can evolve when cracks reopen over multiple drying events rather than forming only once.[8][9]
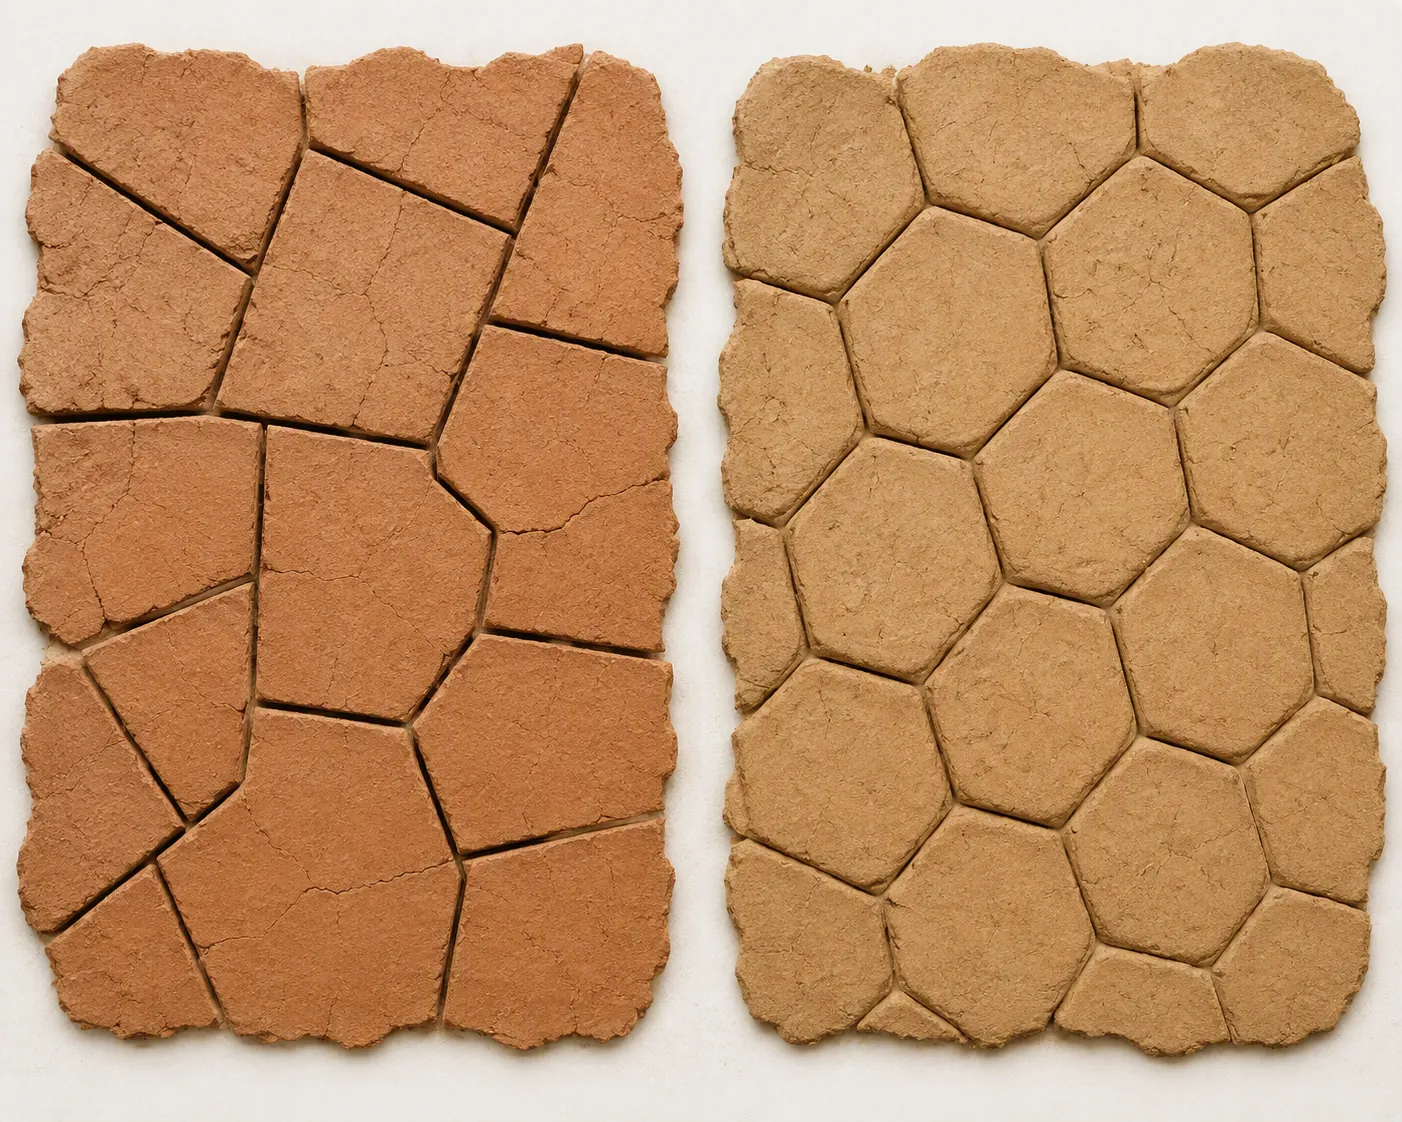
A student designs two simplified laboratory conditions to model those crack patterns.
| Condition | Drying history | Expected junction shape | Expected junction angle | Common polygon shape |
|---|---|---|---|---|
| A | Sediment dries once | T-shaped junctions | Near 90° | Mostly 4- or 5-sided polygons |
| B | Sediment undergoes repeated wet-dry cycles | Y-shaped junctions | Near 120° | Hexagons |
Use Table 2 to answer Questions 5–8.
- In this simplified design, which condition is the repeated-cycle treatment? A. Condition A, because it dries once B. Condition A, because it produces T-shaped junctions C. Condition B, because it undergoes repeated wet-dry cycles D. Condition B, because it has no junction angles
- The expected junction angle in Condition B is about how many degrees greater than the expected junction angle in Condition A? A. 30° B. 60° C. 90° D. 120°
- Which observation would best match the repeated wet-dry cycle model in Table 2? A. T-shaped junctions near 90° and mostly four-sided cells B. Y-shaped junctions near 120° and hexagonal cells C. No polygon boundaries and no junctions D. A rock surface classified only by color
- Which conclusion goes beyond the information in Table 2? A. Repeated wet-dry cycles are associated with Y-shaped junctions near 120°. B. A single drying event is associated with T-shaped junctions near 90°. C. Junction shape can help distinguish between the two drying histories. D. The exact number of wet-dry cycles at every Martian polygon site can be determined from Table 2 alone.
Passage 3 — Conflicting Viewpoints
At Valle Grande, Curiosity photographed a field of honeycomb textures. NASA reported that the polygons are about 4–8 cm across and stated that scientists are measuring their characteristics to narrow down which process formed them.[5] The two viewpoints below use that uncertainty.
Scientist 1: Valle Grande formed by drying mud cracks. If the polygon edges are former cracks in wet sediment, then evidence of evaporation-related minerals along the crack edges would strengthen this explanation. Pontours provides a useful comparison because Curiosity’s ChemCam detected a hard sulfate crust along its crack edges, and the Nature abstract describes sulfate enrichments joined at Y-junctions.[6][10]
Scientist 2: Valle Grande formed by another stress process, such as thermal cycling or compaction during burial. In this view, polygon edges could form from physical stress in rock or sediment without requiring exposed mud to repeatedly dry at the surface. Similar size or shape alone is not enough; the mechanism remains unresolved unless measurements link the pattern to a specific process.
Use the viewpoints to answer Questions 9–12.
- Which statement would both scientists most likely accept? A. Valle Grande’s formation mechanism has already been proven. B. More measurements are needed to determine the formation process. C. Sulfate crust cannot occur along polygon edges. D. Polygon size alone identifies the exact formation mechanism.
- If Valle Grande were later found to have hard sulfate crust concentrated along polygon edges, which viewpoint would that evidence most directly strengthen? A. Scientist 1, because the evidence would resemble the evaporation-related crack-edge pattern described for Pontours B. Scientist 1, because sulfate crust proves the polygons were made by animals C. Scientist 2, because sulfate crust rules out any connection to drying D. Neither scientist, because chemical evidence can never be relevant
- Which hypothetical observation would most strengthen Scientist 2’s alternative-mechanism claim? A. Polygon edges contain sulfate enrichments joined at Y-junctions. B. Polygon junctions are near 120° and form hexagons. C. Measurements show the polygon pattern is best explained by stress from thermal cycling or burial compaction rather than by exposed muddy sediment drying. D. The polygons are visible in a Curiosity image.
- A student writes, “Valle Grande proves that Mars had repeated wet-dry cycles at that site.” Which response best matches the passage? A. Correct, because every honeycomb pattern has the same cause. B. Correct, because Valle Grande and Pontours are both Curiosity sites. C. Too strong, because NASA described Valle Grande’s mechanism as still being investigated. D. Too weak, because no measurements are needed once a rover image exists.
Annotated answer key
Passage 1 answers
- C. The question rewards reading a range, not knowing anything about Mars. Pontours is listed as about 1–7 cm across, so the range width is 7 cm minus 1 cm, or 6 cm.[4] A common trap is choosing 7 cm because it is the largest value shown, but the question asks for the width of the range.
- B. The reported average for Pontours is about 4 cm across.[4] The ACT Science move here is to separate average from minimum and maximum. The 1 cm and 7 cm values are endpoints of the range, not the mean.
- A. Pontours is reported at about 1–7 cm, and Valle Grande is reported at about 4–8 cm, so the two ranges overlap from about 4 cm through 7 cm.[4][5] This does not mean every polygon at one site matches every polygon at the other site. It only means the reported intervals share some values.
- C. The student is treating overlap as proof of mechanism. Table 1 does not allow that. NASA explicitly described Valle Grande as a case where scientists were still measuring polygon characteristics to determine the process that formed them.[5] The skill is distinguishing an observation, such as size overlap, from an interpretation, such as a formation mechanism.
Passage 2 answers
- C. Condition B is the repeated-cycle treatment because the drying history column says it undergoes repeated wet-dry cycles. This item rewards identifying the experimental variable. The answer is not hidden in the Mars setting; it is printed in the condition description.
- A. Condition A is near 90°, and Condition B is near 120°. The difference is about 30°.[6][7] The trap answer is 120°, which repeats the larger angle instead of comparing the two angles.
- B. Repeated wet-dry cycling corresponds to Y-shaped junctions near 120° and hexagons in the simplified model.[6][7] Choice A reverses the conditions by pairing the single-dry pattern with the repeated-cycle model. Choice D uses a visible property, color, that the table never connects to drying history.
- D. Table 2 distinguishes single drying from repeated wet-dry cycling, but it does not give a way to calculate the exact number of cycles at every Martian polygon site. This is the “too much certainty” trap. Some coverage discusses repeated cycles, and one secondary account says perhaps as many as 10 cycles for Pontours, but that estimate is not a universal rule for every polygon field.[4]
Passage 3 answers
- B. Both viewpoints accept that Valle Grande needs more measurements. That shared ground comes straight from the setup: NASA said scientists were measuring polygon characteristics to home in on the process that formed them.[5] Choice A is the opposite of the passage. Choice D is a tempting shortcut, but size alone is not treated as a mechanism test.
- A. Hard sulfate crust concentrated along polygon edges would more directly strengthen Scientist 1 because the drying-mud explanation expects crack-edge evidence tied to evaporation or wet-dry chemistry. Pontours is the comparison case: ChemCam detected a hard sulfate crust along crack edges, and the Nature abstract describes sulfate enrichments joined at Y-junctions.[6][10] The evidence would strengthen the claim; it still would not prove every detail of the mechanism by itself.
- C. Scientist 2 needs evidence that favors a non-drying stress process, such as thermal cycling or burial compaction. Choice C does that directly. Choices A and B point toward the Pontours-style wet-dry pattern instead. Choice D is only an image fact; ACT Science questions often include true statements that do not answer the question.
- C. The student’s sentence is too strong. Valle Grande is the unresolved case in this drill, not the settled one. NASA’s 2026 release says scientists are still measuring characteristics of the polygons to determine which process formed them.[5] The test skill is refusing to turn an active hypothesis into a completed conclusion.
That is the transfer. You did not need rover engineering, Martian climate history, or a memorized list of rock types. You needed to read a range, compare two angles, identify a treatment, separate observation from interpretation, and apply new evidence to competing explanations. Curiosity’s polygon record is dense enough for real ACT Science practice, but the Curiosity facts themselves are not the point on test day.
References
- ACT Science Section Test Tips — ACT.
- ACT Science Passage Types Explained — Test Ninjas.
- Mars Rover Curiosity Examines Possible Mud Cracks — JPL, Jan 2017.
- What Mud Cracks Mean for Life on Mars — Sky & Telescope, Aug 2023.
- NASA's Curiosity Mars Rover Discovers Field of Honeycomb Textures — NASA, Jul 2026.
- Cracks in Ancient Martian Mud Surprise NASA's Curiosity Rover Team — JPL, Aug 2023.
- Curiosity Views Mud Cracks in the Clay-Sulfate Transition Region — NASA Science, Aug 2023.
- Cracking mud, freezing dirt, and breaking rocks — Physics Today, Nov 2014.
- Evolution of mud-crack patterns during repeated drying cycles — Soft Matter, 2010.
- Sustained wet–dry cycling on early Mars — Nature, 2023.
Related exhibits & inventory
Verified outcomes
No verified outcomes on file for this exam yet
See Methodology for how outcome evidence is disclosed once logged.
Planners
No planner filed for this exam yet
A downloadable timeline template for this exam hasn't been published yet.
Tool verdicts
AI-tool cautions
No AI tools tested for this exam yet
No hands-on AI-accuracy logs have been filed for this exam.
Questions about this plan
Ask a question about a specific section, timeline, or citation in this plan — or flag something that needs correcting.
Comments
Join the discussion with an anonymous comment.