
ALL Exam Hub
Africa's Digital Infrastructure Case Study, Explained
Africa's digital infrastructure transformation is real but uneven, and each case carries different evidence. Four cases — M-Pesa, the 2Africa and Equiano subsea cables, national digital ID and payments systems, and the data-center gap — show which parts of the 'leapfrogging' story hold up, with every figure labeled by source, year, and whether it is measured or projected.
- gre
- mcat
- asvab
- sat
- act
- digital-adaptive
- official-material
- section-strategy
- test-date-timeline
Liberia offers a useful way into Africa’s digital infrastructure transformation because its story does not fit a simple success narrative. Fiber connectivity arrived through the Africa Coast to Europe project, yet affordability, network coverage, and internet quality remained unresolved. Mobile money, by contrast, emerged as a relative success. The case suggests that a country can gain an international connection without producing broad, reliable, or affordable internet use.[1]
That is the question to carry through the four cases below: what exactly transformed, at which layer, and what kind of evidence proves it? The answer changes depending on whether the material is an operational history, an assessment of current constraints, a project expectation, or a demand forecast.
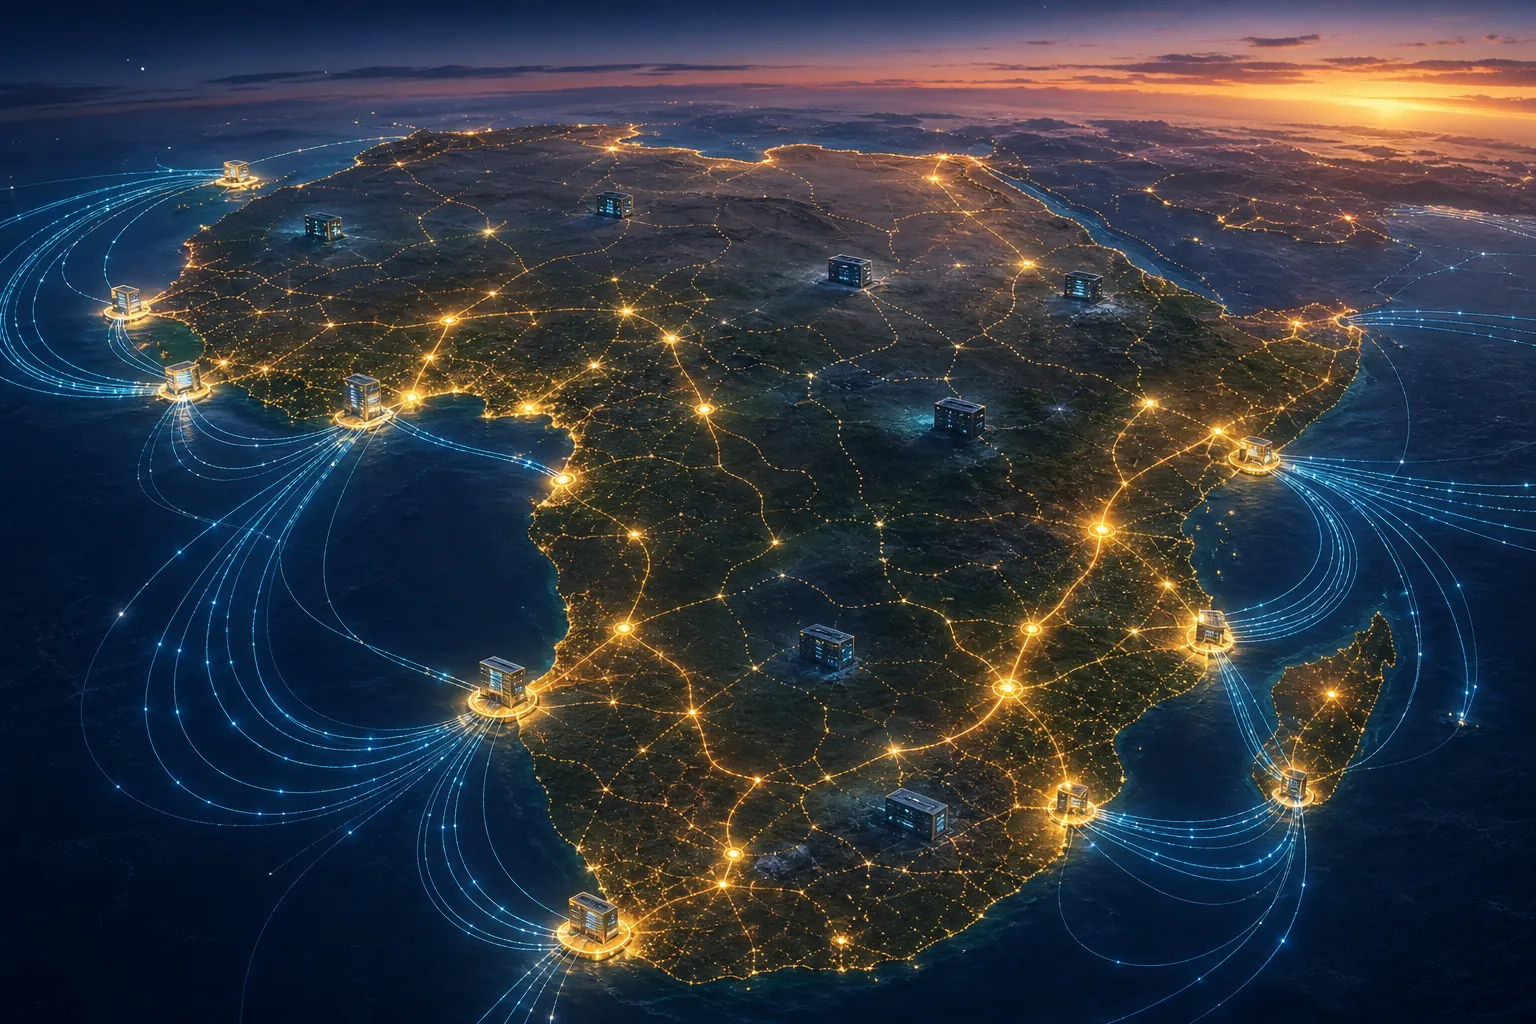
The evidence ledger: four different transformations
Before interpreting the cases, separate the figures by source, year, and status. “Measured” describes an observed condition or recorded operational result. “Estimated” describes a modeled or assessed figure. “Projected” describes a future expectation, not an outcome already delivered.
| Case | Figure | Source and year | Status | What it measures |
|---|---|---|---|---|
| M-Pesa | More than 23 million Kenyan users within a decade of launch in March 2007 | IMD, 2016 | Measured operational history | Adoption and platform growth in Kenya |
| M-Pesa and mobile money | About 51 million M-Pesa customers across seven African countries; 1.2 billion registered mobile-money accounts in Sub-Saharan Africa and North Africa | GSMA, 2025/2026 | Measured account and customer totals | Scale of mobile-money services |
| 2Africa | Approximately 23,000 miles of cable, 21 landings in 16 nations | White & Case, 2022 | Dated project description | Planned and described physical route |
| 2Africa | Expected to roughly double Africa’s internet capacity once complete | White & Case, 2022 | Projected effect | Anticipated capacity change, not observed usage |
| Liberia | Fiber available, but affordability, coverage, and internet-quality gaps persisted; mobile money was a relative success | UNECA, 2025 | Assessment finding | Country-level constraints and outcomes |
| Digital public infrastructure | UGHub grew from 12 to more than 130 connected entities; roughly half a billion Africans lacked foundational ID | Carnegie Endowment, 2025 | Measured growth and estimated regional gap | Interoperability and identity capacity |
| Data centers | 0.4 GW installed capacity, about 1% of world capacity, concentrated in five markets | fDi Intelligence, 2025 | Measured installed base and concentration | Existing physical computing capacity |
| Data centers | Demand projected at 1.5–2 GW by 2030, requiring at least $10 billion in building-shell investment | fDi Intelligence, 2025 | Projected demand and investment requirement | Expected future capacity need |
| Internet use | 36% of Africans use the internet despite more than 80% broadband coverage | ITU, 2025 | Measured regional aggregate | Difference between network availability and actual use |
The ledger prevents a common analytical mistake: placing a verified operating history beside a forecast and treating both as proof of the same kind. M-Pesa’s user totals describe what people did. The 2Africa capacity figure describes what a project is expected to make possible. The data-center figures distinguish what exists now from what may be needed later. Liberia’s case study assesses why infrastructure availability did not yet translate into universal use.
M-Pesa shows what mobile-first transformation can accomplish
M-Pesa is the strongest of the four cases as evidence of a completed operational transformation. Safaricom launched the service in Kenya in March 2007. Within a decade, it had more than 23 million Kenyan users, and the service had helped change Safaricom from a conventional telecom operator into a broader digital platform.[4]
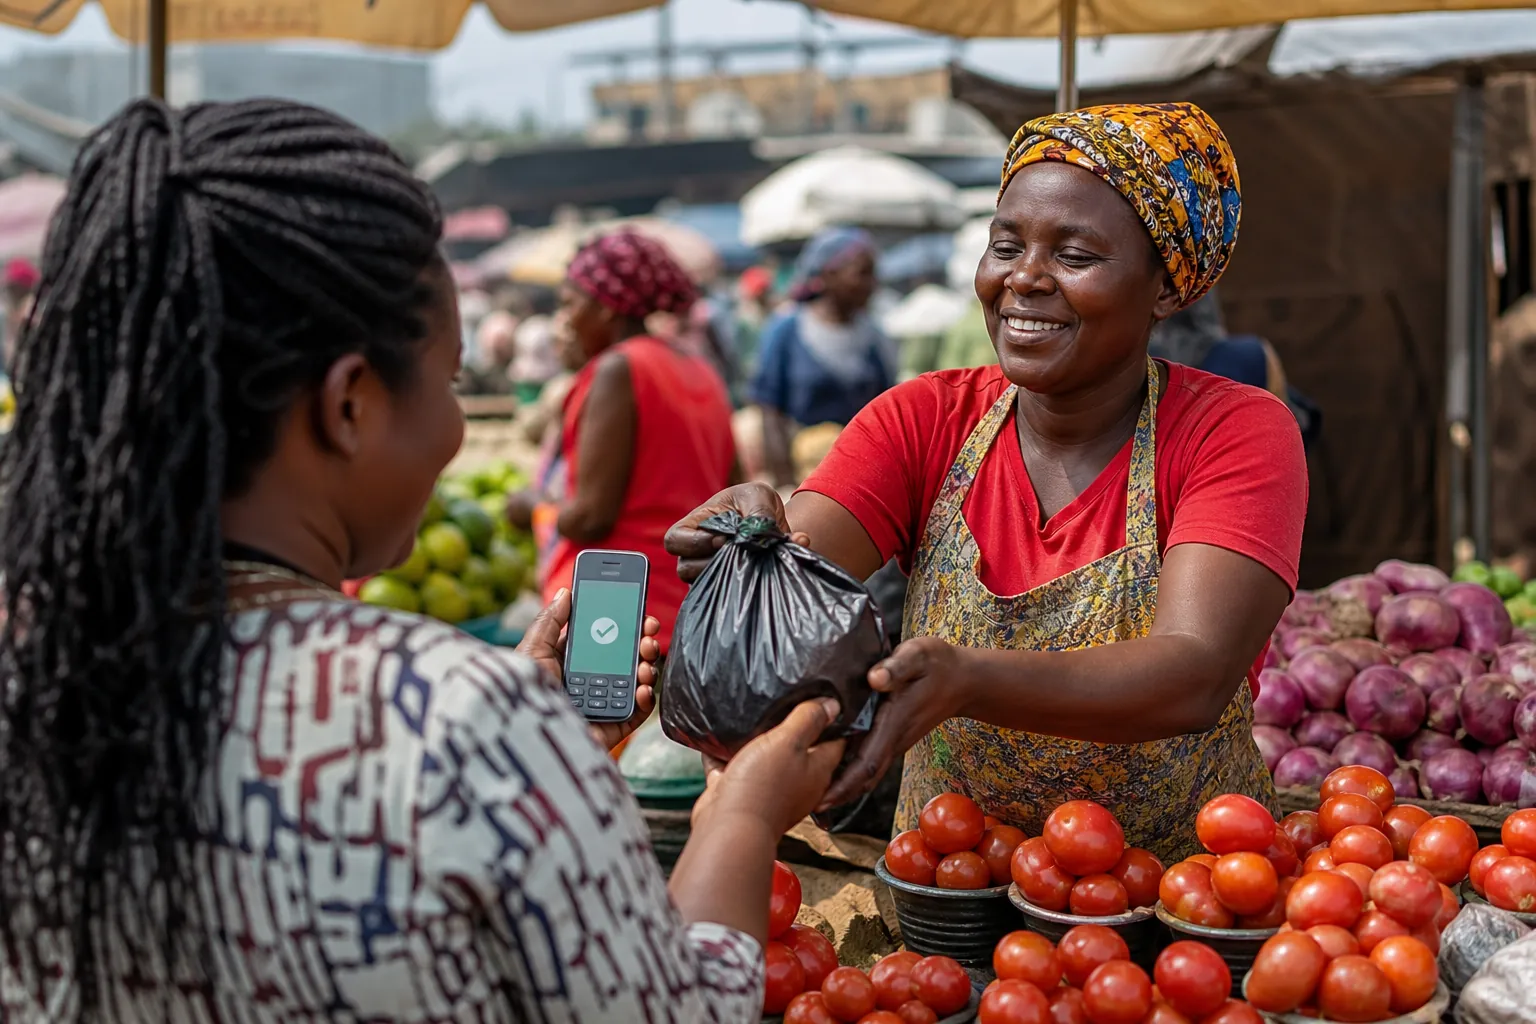
The mechanism matters. Mobile money did not wait for every household to acquire a desktop computer, open a traditional bank account, or use a fully developed fixed-broadband connection. It placed payments and transfers on a widely available mobile channel, supported by an agent network and a service designed around everyday transactions. That is why it is a persuasive example of leapfrogging: an existing communications technology became the delivery route for a service that had previously depended on more formal financial infrastructure.
Later figures show that M-Pesa was not merely a Kenyan launch story. GSMA reported roughly 51 million M-Pesa customers across seven African countries in its 2025/2026 material. The same source recorded 1.2 billion registered mobile-money accounts in Sub-Saharan Africa and North Africa, more than half of the global total of 2.3 billion, while global mobile-money transactions exceeded $2 trillion in 2025.[5]
Those totals measure registered accounts and customers, not identical measures of active use, financial inclusion, or economic welfare. Even so, the operational history is unusually clear: a service launched at a specific time, gained users, expanded across markets, and became part of the region’s payments infrastructure. The case therefore supports a narrower but meaningful conclusion. Mobile-first design can move quickly when the service solves an immediate problem and works through a channel people already possess.
The broader economic significance is also substantial, though it must remain labeled as an aggregate rather than a direct M-Pesa effect. GSMA estimated that mobile technologies contributed $240 billion to Africa’s economy in 2025, equivalent to 7.8% of GDP, and supported approximately 13 million jobs. It forecast a contribution of $290 billion by 2030.[8] The 2030 figure is a forecast; it does not show that the additional contribution has already occurred.
Subsea cables expand the frontier, not the whole user experience
The 2Africa and Equiano projects represent a different mechanism: large-scale private investment in international connectivity. A 2022 description from White & Case placed the 2Africa system at approximately 23,000 miles, with 21 landings in 16 nations. It described the cable as expected to roughly double the continent’s internet capacity once complete.[3]
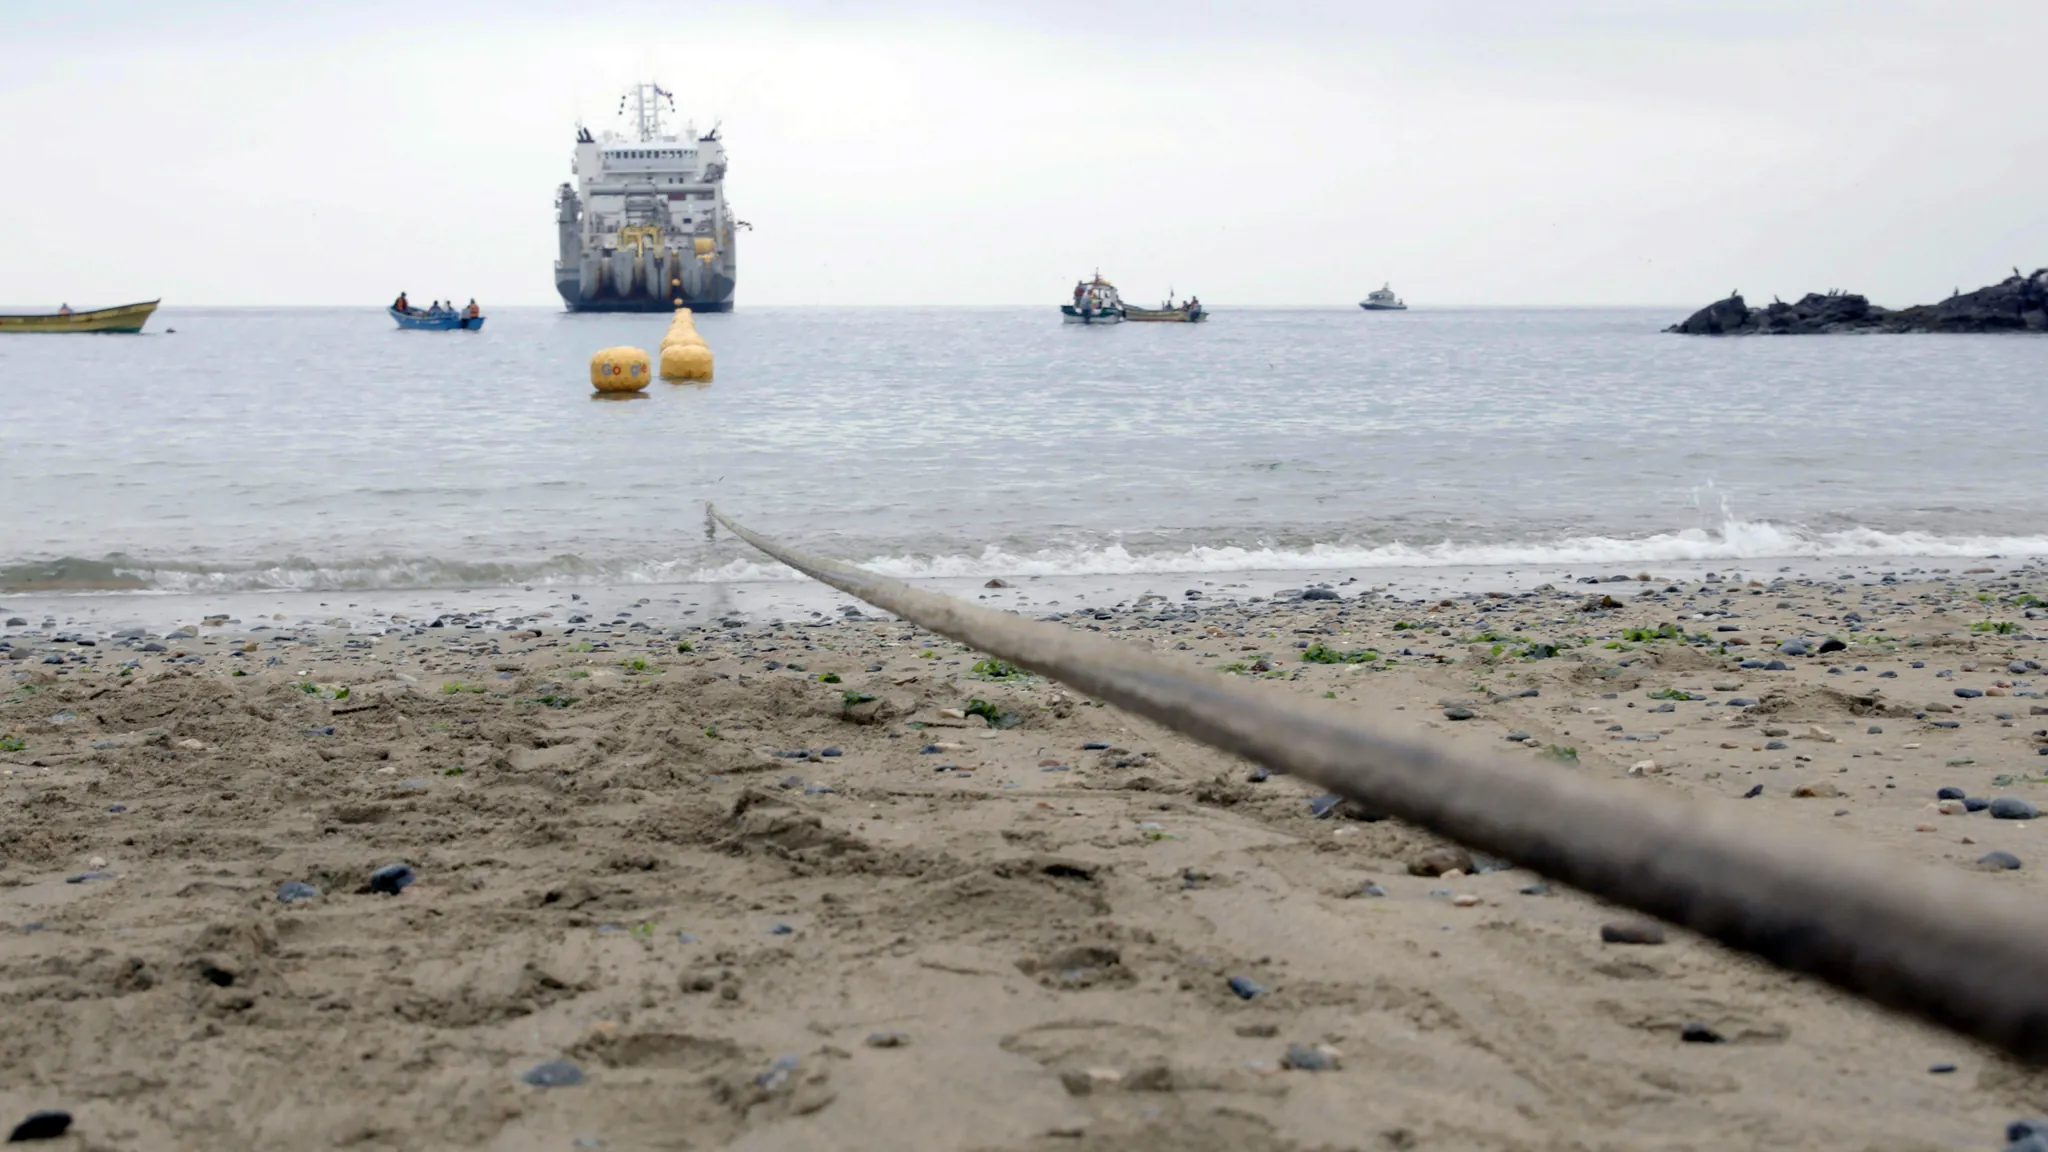
The same account described Equiano as an Atlantic route with landings in Nigeria, Namibia, and South Africa. It also reported that only the Central African Republic, Eritrea, and South Sudan lacked a subsea fiber connection at that time.[3] These details make the physical transformation visible: landing stations, coastal routes, and international links change the network’s available capacity and reach.
But the evidence has a different status from M-Pesa’s user history. The route length and landing details are dated descriptions from 2022. The claim that 2Africa would roughly double capacity is an expectation about the project’s effect. Neither establishes how much capacity consumers will be able to afford, how evenly it will reach inland communities, or how many people will use the resulting services.
This is the distinction between connectivity and use. A cable can reduce the cost or increase the supply of international bandwidth. Local operators still need to connect homes, schools, businesses, and mobile towers. Users need devices, electricity, service quality, and enough income for data. The ITU reported that only 36% of Africans used the internet in 2025 even though more than 80% of the population was covered by broadband.[2] Coverage is therefore evidence that a network is available in an area; it is not evidence that most residents can or do use it.
Digital public infrastructure is a system of systems
The Liberia case makes the cable-to-use gap concrete. Fiber reached the country, but the UNECA assessment still identified affordability, coverage, and internet-quality problems. Mobile money performed relatively well, which creates an instructive contrast inside the same national setting: one digital layer can gain traction while general internet access remains constrained.[1]
This is where “digital infrastructure” needs to be unpacked. Connectivity is the network path. Digital public infrastructure adds shared systems that allow services to interoperate, such as payment exchanges, identity systems, and government data connections. Actual use is the final behavioral and economic result. These layers support one another, but none automatically guarantees the next.
Several country examples show the public-systems layer developing unevenly. Ghana’s GhIPSS, established in 2007, functions as a financial data-exchange backbone. Uganda’s UGHub grew from 12 connected entities to more than 130. Rwanda and Togo endorsed the Digital Public Goods Charter. At the same time, the Carnegie Endowment reported that roughly half a billion Africans still lacked a foundational form of identification.[6]
The comparison is not a contradiction. It shows that national institutions can build interoperable payment or government systems while identity coverage, affordability, or consumer access remains incomplete. Ghana’s payments backbone and Uganda’s expanding government connectivity are evidence of institutional progress in particular systems. They are not evidence that every country has a comparable platform or that all residents can access digital public services.
In 2025, internet use was below 20% in Burundi, the Central African Republic, and South Sudan, alongside much higher use in countries such as Kenya, Rwanda, and South Africa.[2] A regional figure can describe the scale of the gap, but it cannot explain the conditions in an individual country. For an essay or briefing, the country name and measurement year belong next to the number.
A useful evidence-reading habit is to ask four separate questions: Is the network physically present? Can people afford a connection and a device? Can public or private systems interoperate? Is there evidence of repeated, meaningful use? Liberia answers those questions differently at different layers, while Ghana, Uganda, Rwanda, and Togo demonstrate that public infrastructure is being built through nationally specific routes.
Data centers reveal the constraint behind the next phase
Subsea cables address international transport, but digital services also require places where data is processed and stored. Here the evidence points to a less mature layer. fDi Intelligence reported an installed African data-center capacity of 0.4 gigawatts in 2025, approximately 1% of world capacity. Facilities were concentrated in five markets: South Africa with 57, Nigeria with 22, Kenya with 20, Egypt with 13, and Morocco with 12.[7]
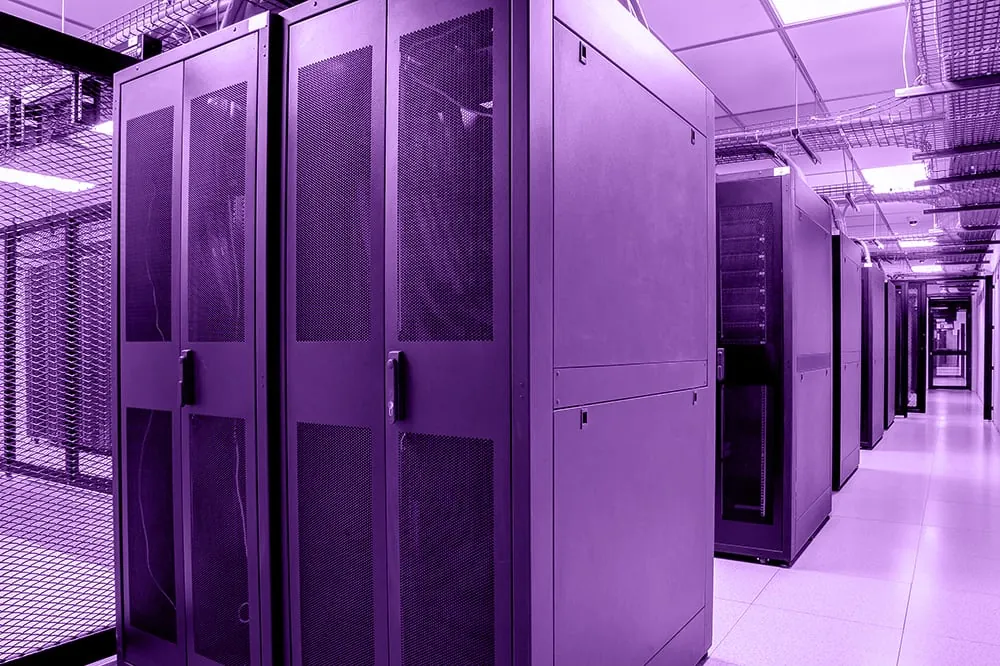
That installed-base figure is a measure of what exists, not a measure of the continent’s full digital demand. The same report projected demand of 1.5–2 gigawatts by 2030 and associated that requirement with at least $10 billion in building-shell investment. It also estimated that 60–70% of forecast demand would be for facilities below 50 megawatts.[7] These are projections and investment requirements, not completed capacity.
The data-center case changes the meaning of leapfrogging. Mobile money could build on a widely distributed handset channel. Large computing facilities require power, cooling, land, network redundancy, financing, and dependable operations. International bandwidth may be available at the coast while local processing capacity remains concentrated in a few markets. A country can therefore be connected to the global network and still depend on distant facilities for services that require low latency, local storage, or reliable domestic hosting.
This does not make data centers a failed case. It makes them a case of delayed and capital-intensive scaling. The measured 0.4 GW installed base establishes a starting point; the 2030 range describes a possible requirement. The distance between those two figures is precisely where financing, energy supply, regulation, and demand will determine what happens.
What the cases support—and what they do not
Taken together, the cases support a qualified leapfrogging argument. Mobile money has moved furthest as a widely used service layer, with M-Pesa providing a documented operational history and regional mobile-money totals showing substantial scale. Subsea connectivity has also advanced through major cable systems, but its strongest claims concern physical reach and expected capacity rather than guaranteed usage. Digital public infrastructure is developing through country-level payment, identity, and data-exchange systems, yet its coverage and maturity vary sharply. Data centers remain a binding physical and capital constraint for the next phase.
The usage gap keeps the conclusion from becoming celebratory. GSMA’s 2026 mobile-economy material described a 63% mobile-internet usage gap compared with a 9% coverage gap.[8] The ITU’s 2025 figures similarly place internet use at 36% against more than 80% broadband coverage.[2] The two measures are not interchangeable, but they point in the same direction: extending networks has moved faster than turning coverage into regular use.
For students evaluating a case study, the most important discipline is to preserve those differences. An operating history can establish adoption. An assessment can identify present barriers. A project description can establish route, scope, or intended capacity. A forecast can describe plausible demand. None should silently be upgraded into proof that the whole transformation has already happened.
That approach resembles the evidence discipline used in guides such as critical-thinking exercises and study skills: identify what a source actually measured before using it to make a larger claim. It is also why named cases are more useful than a single continental slogan. M-Pesa, 2Africa, Liberia’s fiber and mobile-money experience, and the data-center shortfall each illuminate a different layer.
The bounded verdict is therefore straightforward. Africa’s digital infrastructure transformation is real, but it is not moving at one continental speed. Mobile money and subsea connectivity have advanced furthest. Public digital systems are being built but remain nationally uneven. Data centers and universal internet use lag behind the networks and services that make the transformation visible. The “leapfrogging” story holds when it is attached to a specific layer, country, date, source, and evidence status—not when it is used as a substitute for those details.
References
- Case Study on Liberia’s Digital Infrastructure — UNECA, October 2025
- Facts and Figures 2025: Internet Use — ITU, 2025
- Africa’s Digital Infrastructure Transformation — White & Case, May 2022
- Digital Business Transformation in Silicon Savannah: How M-Pesa Changed Safaricom Kenya — IMD, 2016
- Mobile Money Accounted for $2 Trillion in Transactions in 2025, Doubling Since 2021 as Active Accounts Continue to Grow — GSMA, 2025/2026
- Digital Public Infrastructure: A Practical Approach for Africa — Carnegie Endowment for International Peace, February 2025
- Africa’s Data Centre Market: Capacity and Demand — fDi Intelligence, November 2025
- Mobile Technologies Contributed $240 Billion to Africa’s Economy in 2025 as the Continent Enters a New Phase of Digital Transformation — GSMA, 2026
Related exhibits & inventory
Verified outcomes
No verified outcomes on file for this exam yet
See Methodology for how outcome evidence is disclosed once logged.
Planners
No planner filed for this exam yet
A downloadable timeline template for this exam hasn't been published yet.
Tool verdicts
AI-tool cautions
No AI tools tested for this exam yet
No hands-on AI-accuracy logs have been filed for this exam.
Questions about this plan
Ask a question about a specific section, timeline, or citation in this plan — or flag something that needs correcting.
Comments
Join the discussion with an anonymous comment.