
Comparison
A Step-by-Step Guide to Event Studies on Chancellor Appointments
Learn how to design and execute an event study to measure stock and bond market reactions to UK Chancellor appointments, using free tools and avoiding common pitfalls like benchmark contamination.
Verdict panel
- Compared
- not specified
- Target exam
- not specified
- Best for
- not specified
- Pricing last reviewed
- pricing currency unconfirmed
You can run a study of market reactions to a chancellor appointment without writing code. The hard part is not the calculator. It is deciding what the market would have done if the appointment news had not arrived, and that decision becomes awkward when the news is national enough to move the very UK index a student is tempted to use as the benchmark.
The topic is worth studying. AJ Bell’s May 2026 review of 11 UK chancellors who took office mid-term since 1962 found that the FTSE All-Share averaged gains of 3.1% over the first three months, 5.2% over six months, and 9% over one year, using data sourced from LSEG Refinitiv.[1] Those averages are the hook, not the conclusion. The range around them is the real lesson: Alistair Darling’s early period collided with the global financial crisis, Norman Lamont’s with the post-ERM rally, Kwasi Kwarteng’s with the 2022 gilt shock, and Rachel Reeves’ with rising yields despite tax increases.[1]
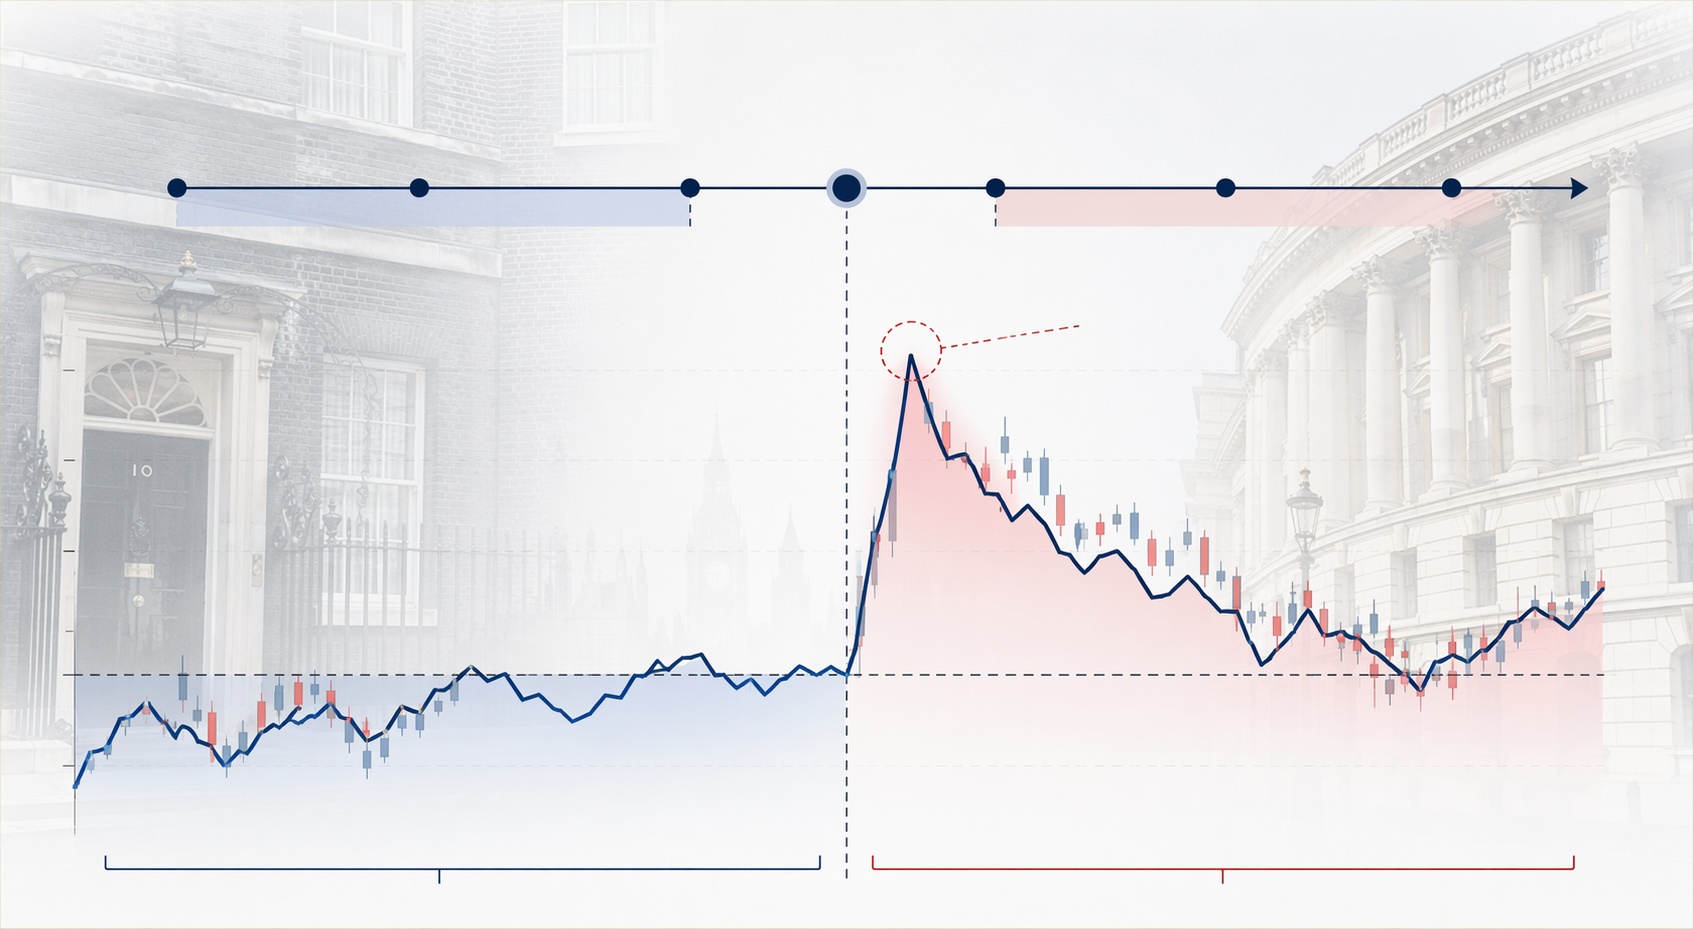
That is exactly why an event study is useful. It narrows the question from “Was this chancellor good for markets?” to “What return was unusual when the appointment news arrived?” Investopedia describes an event study as a method for examining how a specific event affects a security’s value by comparing actual returns with expected returns.[2] For a coursework project, that definition is enough. The rest of the work is operational: choose the event, choose the assets, estimate normal returns, calculate abnormal returns, test whether the reaction is large enough to take seriously, and then interpret it with restraint.
Start With a Question Small Enough to Test
A good research question does not ask whether a chancellor “helped the economy.” It asks whether a defined set of traded securities had abnormal returns around a defined announcement. For example: did UK bank stocks earn positive abnormal returns around a chancellor appointment that investors interpreted as favorable to financial regulation? Did gilt yields move unusually after an appointment associated with fiscal loosening or tightening? Did tax-sensitive sectors react differently from less exposed sectors?
That last version is usually stronger than a broad market question. A whole-market FTSE reaction can be blurred by global risk appetite, Bank of England expectations, commodity prices, and whatever else happened that day. A cross-sectional design asks whether securities with different policy exposure moved differently. Political event studies become more informative when the exposure is explicit rather than assumed.
| Design choice | Better student version | Weak student version |
|---|---|---|
| Event | The first trading day on which the appointment was known to markets | The month or quarter after the appointment |
| Outcome | Abnormal stock return, cumulative abnormal return, abnormal volume, or gilt yield change | Raw three-month share price performance treated as a report card |
| Benchmark | A benchmark plausibly not hit by the same UK political shock | FTSE All-Share as both treated market and expected-return benchmark |
| Interpretation | Market reaction to news under stated assumptions | Proof that the chancellor caused later market performance |
The appointment date also needs care. Use the date when markets could reasonably trade on the information, not merely the ceremonial date. If the appointment was announced after London market close, your main event day may be the next trading day. If the appointment was widely leaked before the formal announcement, you may need a wider event window, such as day -1 to day +1, and you should say why.
The Workflow Before Any Calculator
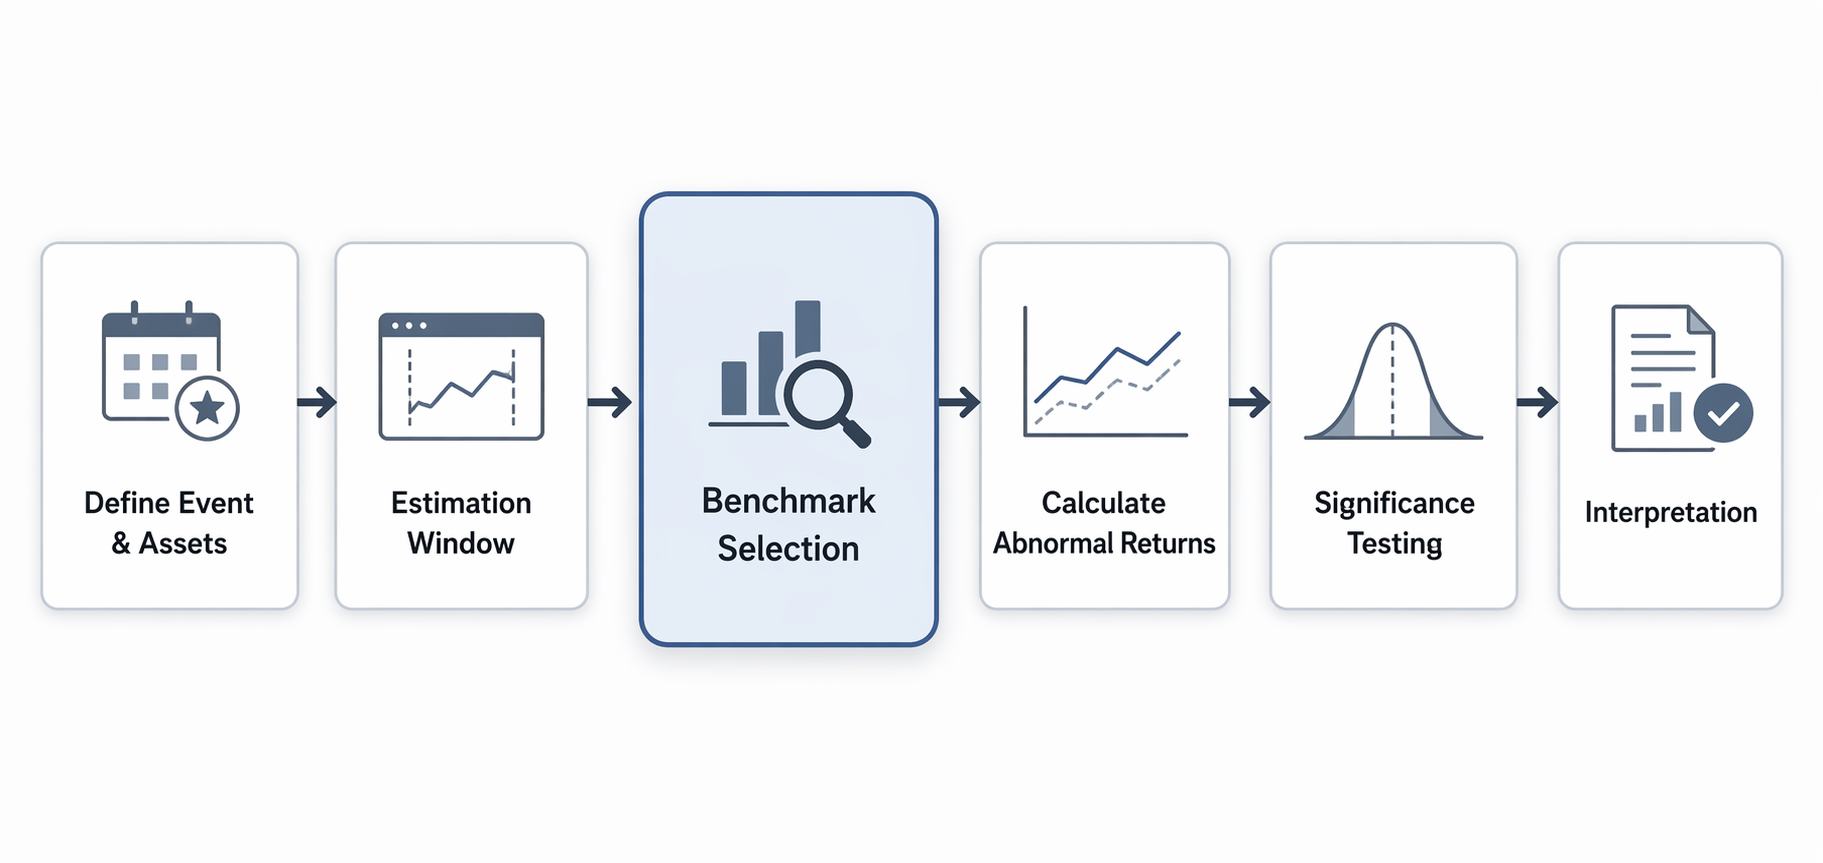
Before opening a free event study tool, write down the design in a short protocol. This is not administrative fuss. It prevents the common habit of trying several windows and benchmarks, then presenting the one that gives the most exciting chart.
- Define the appointment event date and any reason for using a multi-day event window.
- Choose the securities: a market index, sector indices, firms, gilts, or a combination.
- Set an estimation window before the event, leaving a gap so the estimation period is not contaminated by appointment rumors.
- Select a benchmark that estimates normal returns without absorbing the same political shock.
- Calculate abnormal returns and cumulative abnormal returns.
- Test significance, then interpret the economic size and the political context separately.
EventStudyTools’ methodology guide describes the standard architecture: an estimation window to fit expected returns, an event window to measure abnormal returns, and tests for whether the abnormal returns differ from zero.[3] That documentation is published by the tool-maker, so treat it as tool documentation, not as an independent literature review. It is still useful because the calculators implement familiar event-study machinery and cite the academic methods students are likely to encounter in finance courses.
Choose Assets That Match the Political Channel
For a first study, students often choose the FTSE All-Share or FTSE 100 because the data are easy to find. That is acceptable if the question is broad and modest: did UK equities show abnormal movement around the appointment? It becomes less persuasive if the appointment was bundled with a macro-fiscal signal that could move the whole domestic market and the benchmark at the same time.
A cleaner design starts with exposure. If the appointment is expected to matter through bank taxes, study banks. If it matters through housebuilding policy, study housebuilders. If it matters through fiscal credibility, include gilt yields as a parallel outcome. You do not need a biography of the chancellor; you need a plausible channel connecting the appointment news to the securities.
This is where political event studies can become more than “the index went up.” EventStudyTools’ economy-wide events page summarizes cross-sectional findings from the academic literature, including Acemoglu and coauthors’ estimate of roughly 6% cumulative abnormal returns for firms connected to Timothy Geithner after his nomination, and Wagner, Zeckhauser, and Ziegler’s finding that abnormal returns after the 2016 US election rose by 0.41 percentage points for each one-standard-deviation increase in tax-rate exposure.[4] Those are not UK chancellor results, and they should not be imported as expected magnitudes. They show the design logic: markets may react most clearly where the policy exposure is identifiable.
Students who are still building confidence with financial data may want to keep the asset list small: one broad UK equity index, two or three sector indices, and a gilt yield series. If the project grows into a dissertation, move toward firm-level exposure measures. For a broader data workflow beyond market prices, the guide on tracking consumer sentiment for economics students is a useful companion, especially when the political event may affect expectations outside asset markets.
The Benchmark Is Where Many Studies Break
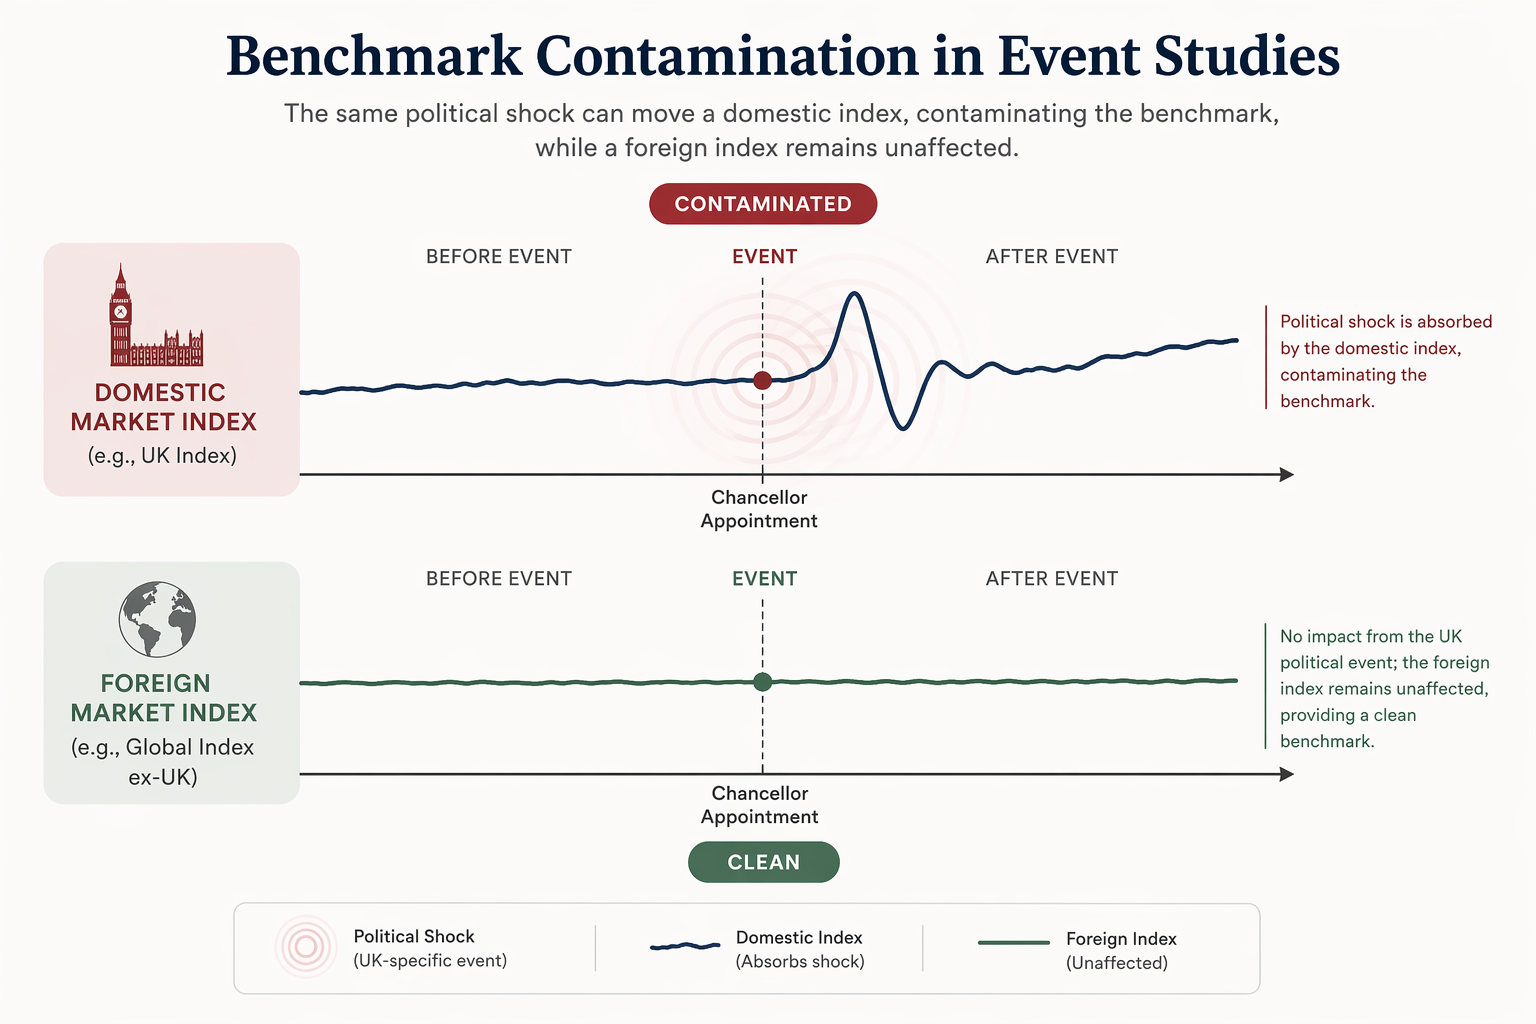
The benchmark is supposed to describe normal market movement. For a single UK company, a UK market index can often serve that purpose. For a UK-wide political shock, it can do the opposite. If the chancellor appointment moves the FTSE All-Share and you use the FTSE All-Share to predict normal returns, you have put part of the treatment into the control.
That contamination usually pushes the study toward false calm. Suppose UK equities rise on appointment news and your treated assets are UK banks. If your benchmark is also a UK index that rises on the same news, the model may explain away some of the bank reaction as “normal market movement.” The abnormal return then looks smaller than the market reaction you are trying to measure. A polished spreadsheet cannot repair that design flaw.
EventStudyTools explicitly warns that economy-wide events create benchmark problems because broad market indices can be affected by the same event being studied.[3] The guide’s suggested alternatives include foreign indices, sector benchmarks, factor models, and synthetic benchmarks.[3] The right choice depends on the asset and the question, not on which data series is most convenient.
| Benchmark option | When it helps | Main caution |
|---|---|---|
| Foreign equity index | Useful when studying a UK-wide appointment shock and needing a market proxy less directly exposed to UK politics | Foreign markets may still react to global risk news on the same day |
| Sector benchmark outside the UK | Useful for UK sector studies, such as banks or housebuilders, where global sector movement matters | The foreign sector may have different regulation, currency exposure, or composition |
| Factor model | Useful when you want to control for broader risk factors rather than one index | Requires more data and more explanation in a student paper |
| Synthetic benchmark | Useful when no single comparison market is convincing | The construction choices must be documented before seeing the result |
| Domestic UK index | Sometimes acceptable for firm-specific events with little economy-wide content | Usually suspect for a chancellor appointment because the index can absorb the same political shock |
There is no magical clean benchmark. A foreign index can be hit by global news. A sector benchmark can import foreign regulatory differences. A factor model can look sophisticated while hiding fragile assumptions. The standard is not perfection; it is whether a reader can see why your benchmark is less contaminated than the obvious domestic alternative.
Set the Estimation Window and Event Window
The estimation window is the pre-event period used to learn the normal relationship between the asset and the benchmark. The event window is the short period around the appointment where abnormal returns are measured. Keep them separate. If rumors, leadership contests, fiscal statements, or budget leaks enter the estimation window, the model is no longer estimating normal behavior.
A common student design is to use a pre-event estimation window ending before the rumor period and then test windows such as day 0, day -1 to day +1, and day 0 to day +1. The exact length should follow the information flow. A surprise appointment announced during trading hours can justify a narrow window. A heavily trailed appointment or a weekend announcement may need a wider one.
Do not quietly expand the event window until the result becomes significant. If you report several windows, present them as robustness checks and explain what each one is meant to capture: leak, announcement, or delayed reaction.
Calculate Abnormal Returns With ARC
The Abnormal Return Calculator, or ARC, can run a standard return event study without coding. According to EventStudyTools’ documentation, ARC supports abnormal return calculation, cumulative abnormal returns, average abnormal returns, cumulative average abnormal returns, and multiple statistical tests.[3] Again, this is tool-maker documentation, so cite it as such if your assignment requires source classification.
In a market-model setup, the idea is simple. Estimate how the asset normally moves with the benchmark during the estimation window. Predict the asset’s expected return during the event window. Subtract expected return from actual return. The remainder is the abnormal return. Add abnormal returns across event days and you have a cumulative abnormal return.
Abnormal return = actual return - expected return
Cumulative abnormal return = sum of abnormal returns across the event window
For ARC, prepare a clean input file with security identifiers, event dates, return data, benchmark returns, and the chosen estimation and event windows. The most important quality checks are dull but necessary: aligned trading days, no accidental weekend event dates, no missing benchmark observations inside the event window, and consistent return units. Mixing percentage returns and decimal returns is a small error that becomes a large embarrassment.
A Minimal ARC Setup
- Security file: the UK index, sector indices, or firms you are studying.
- Event file: appointment date, adjusted to the first tradable date if needed.
- Return file: daily returns for each security over the estimation and event windows.
- Benchmark file: the selected non-contaminated or less-contaminated benchmark return series.
- Settings: estimation window, gap between estimation and event period, event window, and test statistics.
If your paper studies gilt yields, be careful with language. A gilt yield increase is not a stock return increase. It usually means gilt prices have fallen, and it may indicate higher expected rates, inflation compensation, risk premia, or fiscal credibility concerns. AJ Bell’s chancellor review found no clear average direction in gilt yields across chancellor changes, but highlighted a wide range, including Kwarteng’s 2022 mini-budget crisis, Lamont’s post-ERM relief, and Reeves’ rising yields despite tax hikes.[1] That range is a warning against treating every yield move as a clean vote on the appointee.
Volume and News Sentiment Are Optional, Not Decorative
Return reactions are the core of the study. Volume and news sentiment can help if they answer a specific follow-up question. Abnormal volume asks whether trading intensity changed around the appointment. News sentiment asks whether the information environment shifted in tone. EventStudyTools describes AVC for volume event studies and CATA for news-based event studies and sentiment analysis.[5]
Use these only when they add interpretation. If returns are muted but volume jumps, the market may have processed disagreement without a large price change. If sentiment turns sharply negative and yields rise, the combination may support a fiscal credibility interpretation. If you cannot explain why the extra outcome belongs in the design, leave it out. More tabs in the spreadsheet do not make the study more credible.
Significance Testing Is Not a Formality
A single chancellor appointment is not the same as a panel of hundreds of independent firm events spread across many dates. If every asset in your sample has the same event date, their abnormal returns can be correlated because they are all exposed to the same macro news. A naive t-test can then act more confident than the design deserves.
EventStudyTools’ methodology guide discusses test choices including standardized tests and nonparametric approaches, and the broader event-study literature includes corrections such as Boehmer-Musumeci-Poulsen, Kolari-Pynnonen adjustments, and Corrado rank tests for settings where conventional assumptions are strained.[3] The practical point is not to name-drop every statistic. It is to choose tests that recognize event-date clustering and non-normal abnormal returns.
The single-event-date problem is especially severe in political studies. The Cohn-Johnson-Liu-Wardlaw csestudy placebo approach is designed for clustered single-date settings; EventStudyTools reports that a nominal 1% test can reject in more than 20% of placebo periods when this problem is ignored.[3] That is not a small technical quibble. It is the difference between “statistically significant” and “the test is over-rejecting because the design is clustered.”
| Situation | Testing implication |
|---|---|
| One broad UK index around one appointment | Treat inference as fragile; emphasize economic size and robustness rather than strong statistical claims |
| Many UK firms all sharing the same appointment date | Account for cross-sectional dependence and event-date clustering |
| Sector portfolio versus cleaner benchmark | Test CARs, but discuss benchmark choice as part of inference |
| Placebo dates available | Use placebo periods to ask whether similar abnormal returns appear when no appointment occurred |
| Several chancellor appointments pooled | Check whether macro regimes differ so sharply that pooling creates a misleading average |
Placebo tests are often the best student-friendly discipline. Pick non-event dates from similar calendar periods, run the same design, and see how often your method finds a reaction when no appointment occurred. If the study “discovers” appointment-sized effects all over the calendar, the design is too noisy for the claim being made.
Interpreting the Result Without Overclaiming
Interpretation should separate three things: direction, size, and attribution. Direction says whether abnormal returns were positive or negative. Size says whether the move was economically meaningful. Attribution asks whether the appointment news is the most plausible explanation, given other events in the window. The first two can come from the calculator. The third requires judgment.
The AJ Bell historical record is useful precisely because it resists tidy storytelling. Average FTSE All-Share gains after mid-term chancellor appointments look positive over three, six, and twelve months, but the individual episodes are shaped by crises, recoveries, policy shocks, and global conditions.[1] A three-month return after a chancellor arrives is not the chancellor’s personal performance review. It is a market outcome over a period in which many other variables are moving.
For a short coursework paper, a defensible conclusion might read like this: “UK bank stocks showed a positive cumulative abnormal return over the day 0 to day +1 window using a non-UK banking benchmark, but placebo tests show that similar moves sometimes occur in non-event periods, so the evidence is suggestive rather than conclusive.” That is less dramatic than “markets welcomed the chancellor.” It is also much harder to knock down.
For a dissertation, go further by comparing exposed and less-exposed securities. If the appointment was expected to change tax policy, compare firms with different tax exposure. If the appointment signaled fiscal tightening, compare gilt-sensitive sectors with less rate-sensitive sectors. Cross-sectional evidence is where event studies earn their keep because it tests a mechanism rather than just reporting a market-level wiggle.
A Replicable Study Design You Can Actually Submit
A clean student project on chancellor appointments can be compact. Define one appointment or a small set of mid-term appointments. Use daily returns. Study a broad UK index, a few exposed sectors, and gilt yields if fiscal credibility is part of the question. Choose a benchmark that is not simply the same UK market absorbing the same political news. Run abnormal returns in ARC. Add AVC or CATA only if volume or sentiment directly answers the research question. Test significance with awareness of clustering, and use placebo dates where possible.
The result does not need to be spectacular. In fact, a modest result with a well-defended benchmark is usually better work than a striking chart built on a contaminated control. Free tools can get you from appointment date to abnormal returns. Credibility comes from the choices you document before you know whether the line goes up or down.
References
- How the UK's stock and bond markets welcome mid-term Chancellors of the Exchequer, AJ Bell, May 2026.
- Event Studies in Investing: Methods and Impact Analysis, Investopedia.
- Event Study Methodology: A Step-by-Step Guide, EventStudyTools.
- Stock Market Responses to Economy-Wide Events, EventStudyTools.
- Event Study Types: Return, Volume, News, Long-Run, Reverse, EventStudyTools.
Back to the exam this applies to
Target exam not specified — see all exam hubs.
Comments
Join the discussion with an anonymous comment.