
Method
Symptom-Level Analysis Reshapes Depression-Dementia Research
Traditional depression-dementia research treats depression as a binary condition, but symptom-level analysis reveals that only a few specific symptoms drive the risk. This article explains the methodological shift and what it means for interpreting study findings.
Evidence panel
- Evidence level
- High
- Primary citation
- Specific midlife depressive symptoms and long-term dementia risk: a 23-year UK prospective cohort study, The Lancet Psychiatry, 2025.
A depression variable can look reassuringly clean in a regression table: 0 for no depression, 1 for depression. In midlife dementia risk-factor research, that convenience is also the problem. The moment a 30-item symptom questionnaire is compressed into a threshold, the model stops asking which experiences are associated with later dementia and starts treating a mixed score as if it were one exposure.
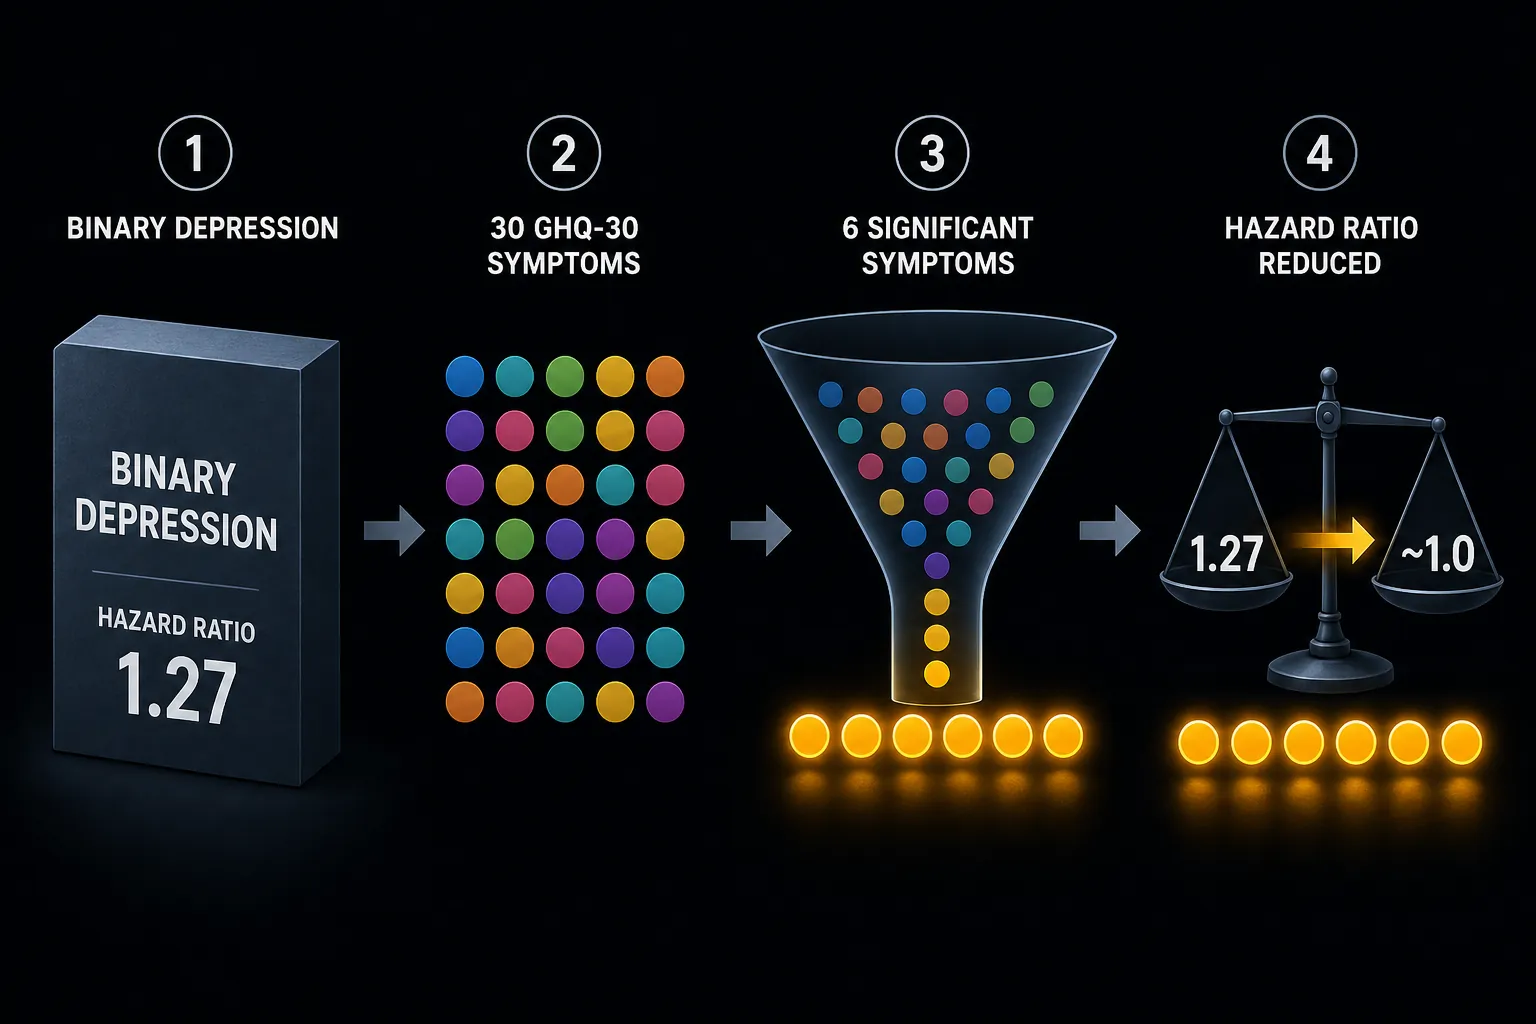
The Whitehall II analysis makes that measurement choice hard to ignore. In 5,811 UK civil servants followed for 23 years, Frank and colleagues first used the familiar binary move: classify participants as depressed when their GHQ-30 score was 5 or higher, then estimate long-term dementia risk. They then opened the same 30-item field and tested the individual symptoms with false-discovery-rate-corrected Cox models. Only 6 of the 30 items were significantly associated with dementia risk; in participants younger than 60, adjusting for those 6 symptoms reduced the binary depression association from a hazard ratio of 1.27 to approximately 1.0.[1]
That is not a small technical footnote. It changes what the binary estimate was measuring. The association did not spread evenly across the syndrome. It was carried by a small subset of symptoms, while many symptoms that readers might expect to matter—sleep problems, low mood, and suicidal ideation among them—showed no significant association in this analysis.[1]
What the binary model can show, and what it cannot
The GHQ-30 threshold is not an absurd instrument. A validated cut-off can be useful when the question is broad screening or descriptive burden: who crosses a level of psychological distress, and how does that group differ from others? A binary variable can also make older cohort studies comparable when finer symptom data are unavailable.
But the Whitehall II question is sharper: which midlife depressive symptoms are linked to dementia decades later? For that question, a total score is a blunt device. Two people can cross the same threshold with different symptom patterns. One may endorse confidence loss and concentration problems; another may endorse sleep disturbance and transient unhappiness. The total score makes those profiles interchangeable before the model ever sees them.
That interchangeability matters because the first binary estimate did find an association. If the analysis stopped there, it would be easy to write the headline as “midlife depression increases dementia risk.” The symptom-level analysis asks whether that statement is too coarse. In the under-60 group, once the 6 dementia-linked symptoms were included, the depression-threshold variable no longer carried the association.[1]
So the careful reading is not “depression is irrelevant.” It is narrower and more useful: in this cohort, the excess risk attached to binary midlife depression was statistically explained by 6 specific GHQ-30 items, not by the full depressive symptom set.
Opening the score into 30 symptoms
The first analytical move was ordinary. Participants were classified by the GHQ-30 cut-off, and dementia incidence was modeled over follow-up. The second move was the one that changes the interpretation: each questionnaire item became its own candidate predictor. Instead of asking whether “depression” predicted dementia, the investigators asked whether each symptom did.
| Analytical move | What it asks | What Whitehall II found |
|---|---|---|
| Binary GHQ-30 classification | Do people above the depression threshold have higher dementia risk? | In under-60 participants, binary depression was associated with dementia risk before symptom adjustment. |
| Item-level Cox models | Which of the 30 symptoms are individually associated with later dementia? | Only 6 symptoms remained significant after false-discovery-rate correction. |
| Attenuation analysis | Does the binary association remain after adjusting for those symptoms? | The under-60 hazard ratio dropped from 1.27 to approximately 1.0. |
| Network analysis | Which symptom is most interconnected within the risk-linked symptom profile? | “Losing confidence in myself” was the central node. |
False-discovery-rate correction is doing real work here. With 30 item-level tests, some associations can appear just because the model has been given many chances to find one. The correction raises the evidentiary bar. After that adjustment, the signal narrowed to 6 items.[1]
That narrowing is exactly the point. A total score can rise for many reasons, but the dementia association in this analysis did not behave as though every reason mattered. The model treated the symptom field less like a single thermometer and more like a map: most locations were not where the signal was.
The attenuation result is the load-bearing result
Attenuation is a plain idea with a technical name. Estimate the association between binary depression and dementia. Then add the candidate explanatory symptoms to the model. If the depression coefficient stays similar, the binary variable is carrying information beyond those symptoms. If it shrinks toward the null, the symptoms are accounting for the association.
In the under-60 Whitehall II participants, the shrinkage was decisive: the hazard ratio moved from 1.27 to approximately 1.0 after adjustment for the 6 significant symptoms.[1] That does not prove the symptoms cause dementia. It shows that the binary depression estimate was not an independent summary of the whole syndrome’s dementia risk. It was a container for a smaller symptom-specific association.
This is where many broad risk-factor claims become unstable. If a total score is associated with an outcome, it is tempting to treat the score as a biological or clinical entity. But a score is often an accounting rule. It says how many boxes were checked, or how heavily they were weighted. It does not guarantee that the checked boxes share the same long-term relationship with dementia.
For a critical reader, the important sentence is not merely “depression predicted dementia.” It is: “The binary association disappeared after adjustment for the 6 symptom items that survived item-level testing.” That sentence tells us where the estimate came from.
Why the confidence item deserves attention without becoming a morality tale
The most tempting overread in the paper is also one of its most interesting findings. Network analysis using regularized partial correlation networks via graphical LASSO identified “losing confidence in myself” as the central node among the dementia-linked symptom profile. In under-60 adults, that item alone accounted for approximately 90% of the attenuation of the binary depression association.[1]

Statistically, “central” does not mean “deepest,” “most authentic,” or “the psychological root.” It means that, within the estimated symptom network, this item had the strongest pattern of connections with the other risk-linked symptoms after regularization. The finding is about the structure of associations among variables, not a clinical verdict on self-esteem.
Still, the result matters. If one item accounts for most of the attenuation, it tells us that the binary depression variable was heavily dependent on a particular part of the symptom field. A reader who sees only the threshold variable cannot know that. The threshold hides whether the association is distributed across low mood, sleep, fatigue, suicidality, confidence, concentration, or some narrower cluster.
This is also why the result should not be converted into advice such as “treat confidence loss to prevent dementia.” The Whitehall II analysis was observational. It did not assign participants to a symptom-targeted intervention, and it did not test whether changing any item would change dementia incidence. A predictive or explanatory variable in a cohort model is not automatically a modifiable causal lever.
The stability finding separates persistent signal from passing distress
One possible objection to symptom-level work is that individual items may be noisy. A person can sleep badly for a week, feel unusually low during a stressful month, or answer a questionnaire differently depending on context. If the dementia-linked symptoms were mostly passing states, the long-term interpretation would weaken.
Whitehall II addressed that problem with tetrachoric correlations across time. The 6 dementia-linked symptoms showed moderate-to-high 10-year stability, with correlations ranging from 0.43 to 0.53.[1] Tetrachoric correlation is used when the observed variables are binary but are treated as indicators of an underlying continuous tendency. In practical reading terms, the authors were asking whether people who endorsed these symptoms at one phase were more likely to endorse them again later.
That stability does not make the symptoms immutable traits. It does suggest they were not merely random questionnaire noise or short-lived mood episodes. For dementia-risk interpretation, this matters because a persistent vulnerability profile is a different object from a temporary symptom flare.
Robustness checks reduce some easy objections
No observational cohort can close every causal loophole, but some checks are more informative than others. Whitehall II tested whether the findings were likely to be a simple artifact of chance, reverse causation, or death competing with dementia diagnosis.
- Permutation testing: none of 1,000 shuffled datasets produced a hazard ratio as extreme as the observed association.[1]
- Lagged-onset exclusion: results were materially unchanged after excluding dementia cases occurring within 10 years, a check aimed at prodromal reverse causation.[1]
- Competing-risk modeling: Fine-Gray models treating death as a competing event did not materially change the results.[1]
These checks do not turn the study into a trial. They do make the simplest dismissals less persuasive. The symptom-level association was not easily explained as a random multiple-testing artifact, a short preclinical dementia window, or a death-related distortion of observed dementia incidence.
The limitations remain important. Whitehall II is a civil-service cohort, 72% male and 92% White, so its demographic range is narrow.[1] Replication in more diverse populations and with other depression instruments is not a decorative next step; it is necessary before treating the 6-item pattern as a general rule.
Why the older literature looks mixed
The broader depression-dementia literature has long looked stronger in some places than others. A BMJ Open meta-analysis of 36 longitudinal studies, including 66,532 participants, reported that late-life depression was associated with roughly doubled dementia risk, with hazard ratios in the 1.83 to 2.04 range depending on dementia subtype. The same review found weaker associations in longer follow-up studies, which is one reason midlife-specific measurement matters.[2]
That contrast is not surprising if different studies are measuring different things under the same label. Late-life depression can be closer to dementia onset and therefore more vulnerable to prodromal explanations. Midlife depression has a longer temporal gap, but if it is still measured as a total score or yes/no exposure, the model may be mixing risk-linked symptoms with symptoms that carry little or no long-term dementia signal.
Other designs try to solve adjacent problems. Some studies use repeated depression measures, specialist diagnostic outcomes, mediation models, or propensity-score matching. Those choices can improve specific parts of inference, such as timing, confounding balance, or pathway estimation. They do not, by themselves, solve the measurement problem if the exposure remains a broad depression category.
This is the useful role of Whitehall II in the field. It does not replace every cohort, every clinical diagnosis, or every causal method. It shows that before arguing about mechanisms, researchers may need to ask whether the exposure variable is too crude to support the claim being made.
How to read the next depression-dementia paper
For readers using this as a methods problem rather than a clinical takeaway, the first question is not whether the abstract says depression is a risk factor. The first question is how depression entered the model.
- If the paper uses a binary threshold, ask whether the research question is broad screening or symptom-specific risk.
- If the paper reports a total-score association, ask whether item-level analyses show which symptoms carry it.
- If many symptoms are tested, ask how the authors handled multiple comparisons.
- If dementia occurs soon after depression measurement, ask whether lagged-onset exclusions address prodromal reverse causation.
- If the cohort is demographically narrow, ask whether the authors limit generalization accordingly.
Those questions fit naturally within broader methods reading: define the exposure, inspect the adjustment set, check the follow-up window, and separate what the model estimates from what the headline implies.
The disciplined conclusion is narrower than both the alarming and reassuring versions. Symptom-level analysis does not show that depression is irrelevant to dementia risk. It also does not show that treating 6 symptoms would reduce dementia incidence. It shows that, in a long-running midlife cohort, the binary depression association was carried by a small subset of symptoms and disappeared after those symptoms were modeled directly. In 2026, that makes one habit much harder to defend: treating depression as a single yes/no exposure and then presenting the resulting estimate as if it identified the syndrome’s dementia risk.
References
Applies to
Exam applicability isn't specified for this technique yet. See all exam hubs.
Comments
Join the discussion with an anonymous comment.