
NFL COMBINE Exam Hub
What Rookie Evaluation Studies Reveal About Predicting Player Success
A cross-sport synthesis of peer-reviewed research showing that combine tests, college production, and scouting grades each have weak-to-modest correlations with future performance. The evidence explains why draft hype consistently outruns predictive reality across the NFL, NBA, and MLB.
- SAT
- ACT
- GRE
- MCAT
- ASVAB
- digital-sat
- adaptive-testing
- registration-fee
- content-outline
- score-target
Rookie evaluation studies usually sound more decisive than they are. The stopwatch gives a number. The vertical jump gives a number. College production gives a number. Draft position gives the cleanest number of all. Then the rookie season arrives and a fourth of the sample may not even get on the field.
That last point is not a throwaway caveat. In Ryan et al.’s 2024 study of 315 NFL Combine participants, only 8% completed all seven combine events, 24% played zero rookie-season snaps, and combine performance Z-scores explained just 3.6% of the variance in rookie playing time.[1] The useful lesson is not that testing is pointless. It is that a measured trait and an NFL decision are separated by injuries, roster depth, coaching trust, draft investment, position needs, special-teams roles, and simple non-opportunity.
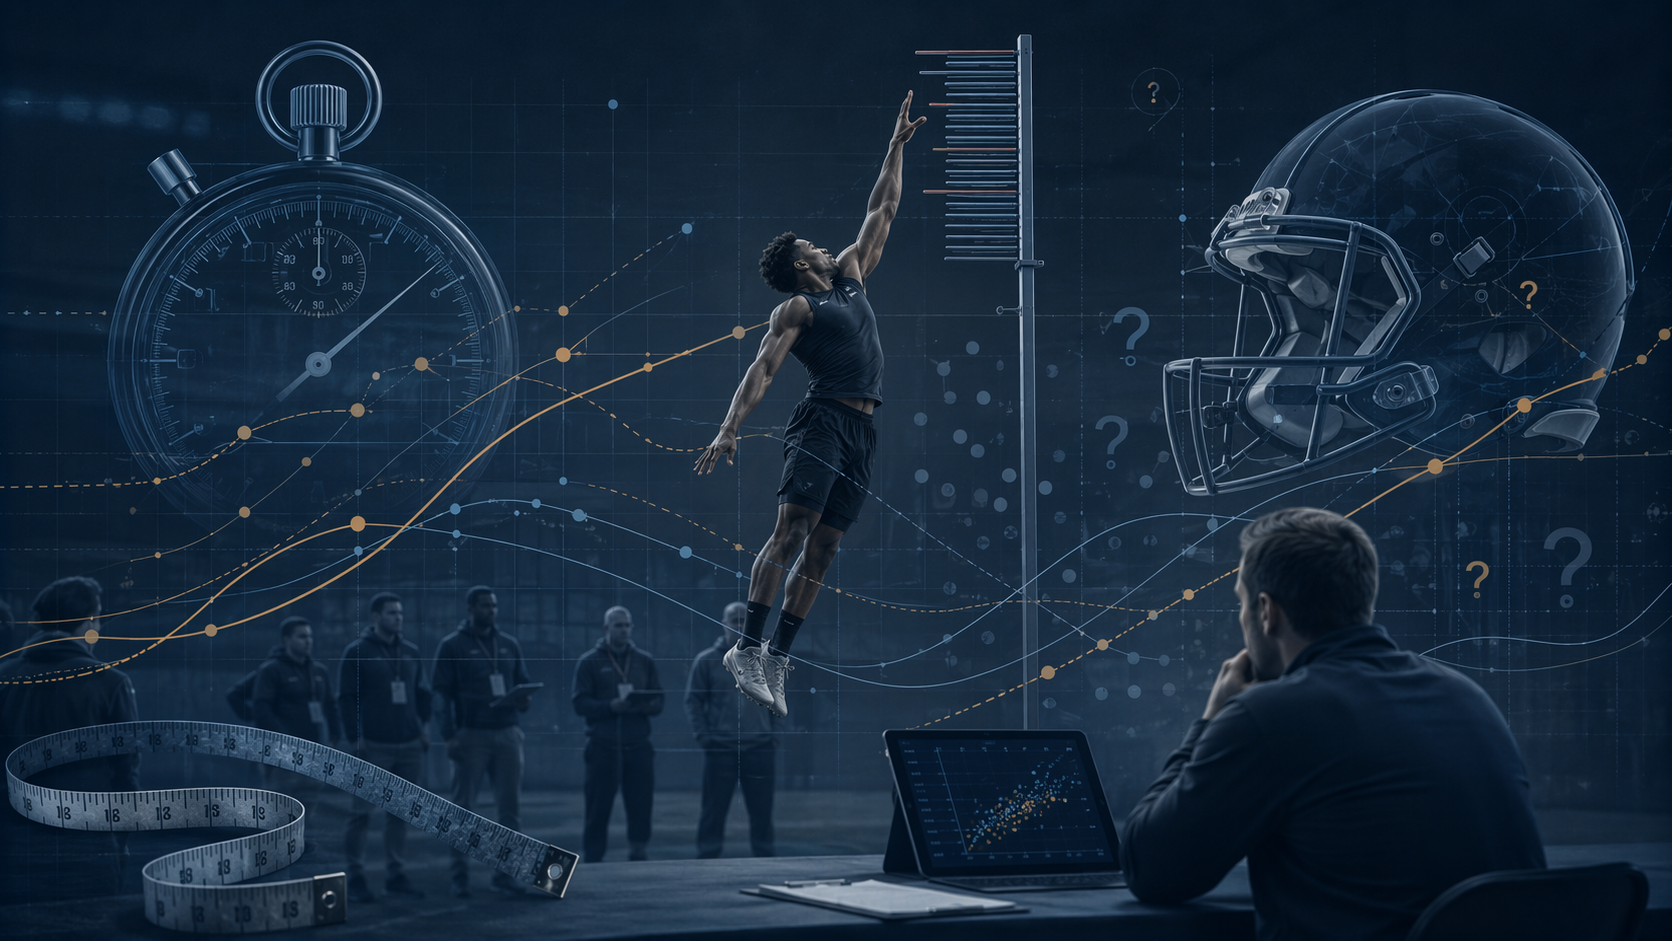
The Combine Measures Real Traits, Just Not Enough of the Decision
Combine events are attractive because they look standardized. A 40-yard dash does not need a broadcast panel to interpret it. A bench-press total looks like effort translated into arithmetic. A broad jump appears to compress lower-body power into one clean mark. For a front office, those measurements are still useful: they can confirm thresholds, flag outliers, and test whether a player’s athletic profile fits a role.
The problem begins when threshold information is treated as a forecast. Tucker and Black’s 2021 study of 1,009 players found that combine performance helped separate drafted from undrafted players at a basic level, but it was not a good predictor of draft position once inside the drafted population.[2] That distinction matters. Clearing an athletic bar is not the same as ranking prospects accurately.
Ryan et al. add the more uncomfortable rookie-year version of the same issue. If combine Z-scores explain only about 4% of rookie playing-time variance, then most of what determines early opportunity is being explained somewhere else—or is not being explained well at all.[1] Some of that “somewhere else” is talent evaluation. Some is organizational behavior. Some is depth chart luck. Some is whether the rookie is active on Sundays.
Partial participation also weakens the neatness of combine databases. When only 8% of the Ryan et al. sample completed all seven events, the missingness is not just clerical noise.[1] Top prospects may skip events, injured players may participate selectively, and agents may steer clients away from tests likely to damage their draft stock. The final spreadsheet looks objective, but the path into each cell is strategic.
Adding Production Helps, but the Ceiling Stays Modest
College production feels like the natural corrective to combine worship. If a receiver actually dominated targets, or a quarterback completed passes at a high rate, that should pull the discussion away from workout theatrics. It does, but only up to a point.
Sports Info Solutions’ 2022 athleticism-versus-production study gives a useful boundary. Athleticism correlated with draft position at r = 0.25, production at r = 0.24, and the combination reached r = 0.33.[3] That is an improvement, not a breakthrough. A combined model can be better than either ingredient while still leaving most of the outcome unexplained.
| Signal | Finding | What It Supports |
|---|---|---|
| NFL Combine Z-scores | r² = 0.036 for rookie playing time in Ryan et al. | Athletic testing has limited rookie-year explanatory power |
| Combine performance and draft position | Helps separate drafted from undrafted, but does not explain draft order well | Threshold value is stronger than ranking value |
| Athleticism + production | Combined model reaches about r = 0.33 in SIS study | Blending signals helps, but predictive strength remains modest |
There are good reasons the ceiling is not higher. College production is produced inside a college environment: scheme, opponent quality, conference strength, teammate quality, age, role, and usage all travel with the stat. A running back’s yardage total may reflect vision and contact balance, but also line play and volume. A quarterback’s completion percentage may reflect accuracy, but also route depth, receiver separation, and play-calling.
Northwestern Sports Analytics Group’s 2024 work points in this direction without overselling it. In its college-to-NFL modeling, height and college completion percentage were significant for quarterbacks at p < 0.05, while Dominator rating was significant for wide receivers at p = 0.0366.[4] Those are position-specific findings. They do not license a general claim that college statistics “solve” the draft.
The NBA Shows the Same Pattern in a Cleaner Laboratory
Basketball is helpful because individual impact is easier to see than in football, and the combine includes measurements that seem obviously relevant: height, wingspan, standing reach, agility, sprinting, jumping. Even there, the measured relationship is restrained.
Teramoto et al.’s 2018 study of 234 NBA Combine participants found that most individual test correlations with on-court performance were below r = 0.30, with size and length showing the more meaningful links to defensive metrics.[5] That is plausible in basketball. Length changes contests, passing lanes, rim protection, and defensive versatility in a way a vertical leap may not.
The familiar outliers are useful only if they stay in their lane. DJ Stephens’ 46-inch max vertical at the NBA Combine did not make him a drafted player, and Kevin Durant’s zero bench-press reps did not stop him from becoming an MVP.[5] Those examples do not prove that athletic testing fails. They show why a single test result can become absurd when detached from basketball context.
This is where the entertainment product and the evaluation problem split. Fans can enjoy a record vertical jump. Scouts can note it. Analysts can add it to a profile. The methodological error is turning the measurement into a destiny claim before asking whether similar measurements have actually predicted the outcome being discussed.
Draft Pedigree Looks Stronger Because It Also Buys Opportunity
Draft position is often the best single predictor in rookie evaluation studies. It also carries the most interpretive baggage. A first-round pick is not only a player whom the team rated highly. He is a player the team has publicly invested in, budgeted for, explained to ownership, and often planned around before his first professional practice.
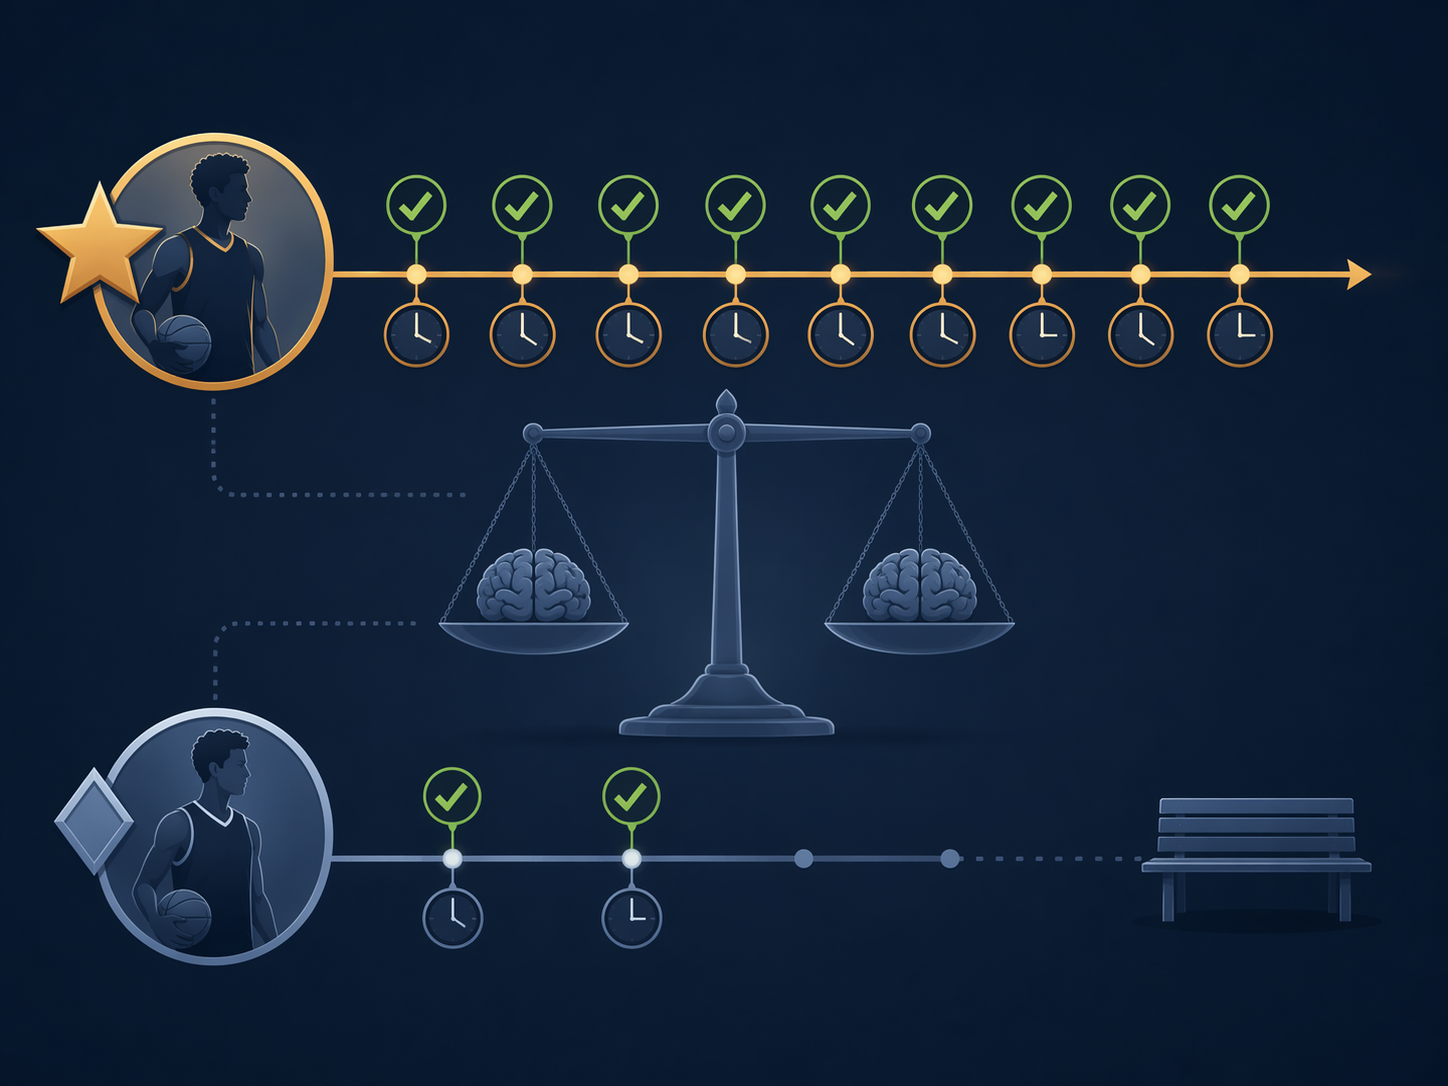
Northwestern’s 2014-2023 quarterback finding is a clean illustration: 81% of first-round quarterbacks started significant games, compared with 15% of fourth-round-or-later picks.[4] That statistic contains evaluation, but it also contains access. A first-round quarterback is more likely to receive practice reps, offensive installation time, patience after mistakes, and another chance after the first bad month.
Johnston et al.’s 2022 systematic review of 18 articles on North American sports drafts adds another wrinkle: early and late rounds were the most accurately predictive of success, while middle rounds were significantly less accurate.[6] That is not the pattern one would expect if draft order were a smooth talent meter. It looks more like a market where the top carries heavy consensus and opportunity, the bottom is easier to classify after the fact, and the middle is where uncertainty lives.
League structure changes the stakes. Lopez’s 2016 draft-curve comparison estimated that the top NBA pick carried roughly 20 times the expected value of a late second-round pick, while the top NFL pick carried roughly twice the expected value of a late second-round pick.[7] The exact curves may have shifted with later labor rules and roster economics, but the structural point remains important: in basketball, one star can bend a franchise more sharply than one football player usually can.
That makes “draft success” a slippery outcome. If success is measured by starts, minutes, snaps, or games played, the analysis is partly measuring the organization’s willingness to keep feeding the investment. If success is measured by efficiency, the sample shrinks and role context becomes harder to handle. Neither choice is wrong. Both choices need to be named.
Scouting Grades Are Structured Judgment, Not Magic
Baseball’s 20-80 scouting scale is a useful reminder that scouting is not just a person with a stopwatch and a hunch. MLB.com defines 50 as major-league average, 60 as above average, and 70-80 as All-Star caliber.[8] The scale forces evaluators to translate tools into a shared language, which is better than pretending every note is equally precise.
Still, a grade is a disciplined judgment, not an independent physical law. It can combine observation, projection, age, body type, mechanics, and comparison history. That is exactly why it may be valuable. It is also why it should not be read as if it were the same kind of measurement as a sprint time.
The better use of scouting grades is comparative and probabilistic: which tools are already present, which require projection, which weaknesses might block playing time, and which role would let the player survive while developing. That kind of judgment belongs in rookie evaluation. It just should not be advertised as if a 60-grade future tool removes uncertainty.
Cognitive Testing and AI Are Promising, but the Evidence Grade Changes
Cognitive assessment is the fastest-growing part of the discussion, and it is easy to see why. Processing speed, anticipation, visual attention, and decision-making sound closer to game performance than a shirt-and-shorts drill. CBS Sports reported in 2024 that all 32 NFL teams use cognitive assessments such as AIQ, S2, and HRT.[9]
Adoption is not validation. A team may use a test because it adds a different data point, because a coach trusts it, because a quarterback process includes it, or because no one wants to be the club ignoring a tool competitors have bought. Those are operational reasons, not peer-reviewed proof that the test predicts rookie success across positions and contexts.
The same caution applies to AI movement analysis and computer vision. Brookings described NFL teams deploying AI and computer vision for movement analysis and injury-risk work in 2021.[10] That is an important development in how teams collect and process information. It does not, by itself, establish that an AI-derived movement score outpredicts conventional evaluation or travels reliably from one team environment to another.
The right standard is boring and necessary: independent validation, clear outcomes, position-specific samples, out-of-sample testing, and an honest distinction between predicting talent and predicting opportunity. Until that literature is thicker, cognitive and AI tools belong in the portfolio of weak-to-possibly-useful signals, not above it.
What a Careful Rookie Evaluation Can Honestly Claim
The evidence does not support the lazy version of skepticism, where every missed pick becomes proof that teams know nothing. Teams are solving a hard problem with incomplete information, uneven participation, different incentives, and outcomes partly controlled by their own later decisions. A rookie evaluation process can be useful and still have modest predictive validity.
The honest claim is narrower: combine tests can identify athletic thresholds and outliers; college production can show role success in a prior environment; scouting grades can organize experienced judgment; draft position can reveal both consensus and institutional commitment; cognitive and movement tools may add information, but need more independent validation. None deserves to be sold alone as a strong forecast.
That is the practical answer for anyone reading rookie evaluation research in 2026. Use the signals together. Weight them by position and context. Watch for opportunity bias before praising the model. Be especially careful when the outcome is playing time, because teams do not merely discover playing time; they allocate it.
Draft season will keep rewarding certainty because certainty is easier to televise. The studies reward a different habit: treating rookie evaluation as a portfolio of partial evidence, where the best methods reduce ignorance but do not remove it.
References
- Ryan et al. rookie playing-time study, The Sport Journal, 2024.
- Tucker & Black combine performance and draft position study, The Sport Journal, 2021.
- Athleticism vs. Production study, Sports Info Solutions, 2022.
- Northwestern Sports Analytics Group college-to-NFL success model, Northwestern Sports Analytics Group, 2024.
- Teramoto et al. NBA Combine participant study, PubMed, 2018.
- Systematic review of 18 articles on North American sports drafts, PubMed, 2022.
- Draft curve comparison, Stats by Lopez, 2016.
- Scouting Grades, MLB.com Glossary.
- CBS Sports reporting on NFL cognitive assessments, CBS Sports, 2024.
- NFL teams deploying AI and computer vision for movement analysis and injury risk, Brookings, 2021.
Related exhibits & inventory
Verified outcomes
No verified outcomes on file for this exam yet
See Methodology for how outcome evidence is disclosed once logged.
Planners
No planner filed for this exam yet
A downloadable timeline template for this exam hasn't been published yet.
Tool verdicts
AI-tool cautions
No AI tools tested for this exam yet
No hands-on AI-accuracy logs have been filed for this exam.
Questions about this plan
Ask a question about a specific section, timeline, or citation in this plan — or flag something that needs correcting.
Comments
Join the discussion with an anonymous comment.