
ACT Exam Hub
How to Read the 2027 Solar Eclipse Path Map
A practical map-reading lesson for astronomy students built around the August 2, 2027 total eclipse — what the umbra's track versus the penumbra means, what the central line and path limits represent, and why totality duration varies from city to city. Every location's numbers can be checked against NASA's interactive eclipse map rather than trusted from a static image.
- gre
- mcat
- asvab
- sat
- act
- digital-adaptive
- official-material
- section-strategy
- test-date-timeline
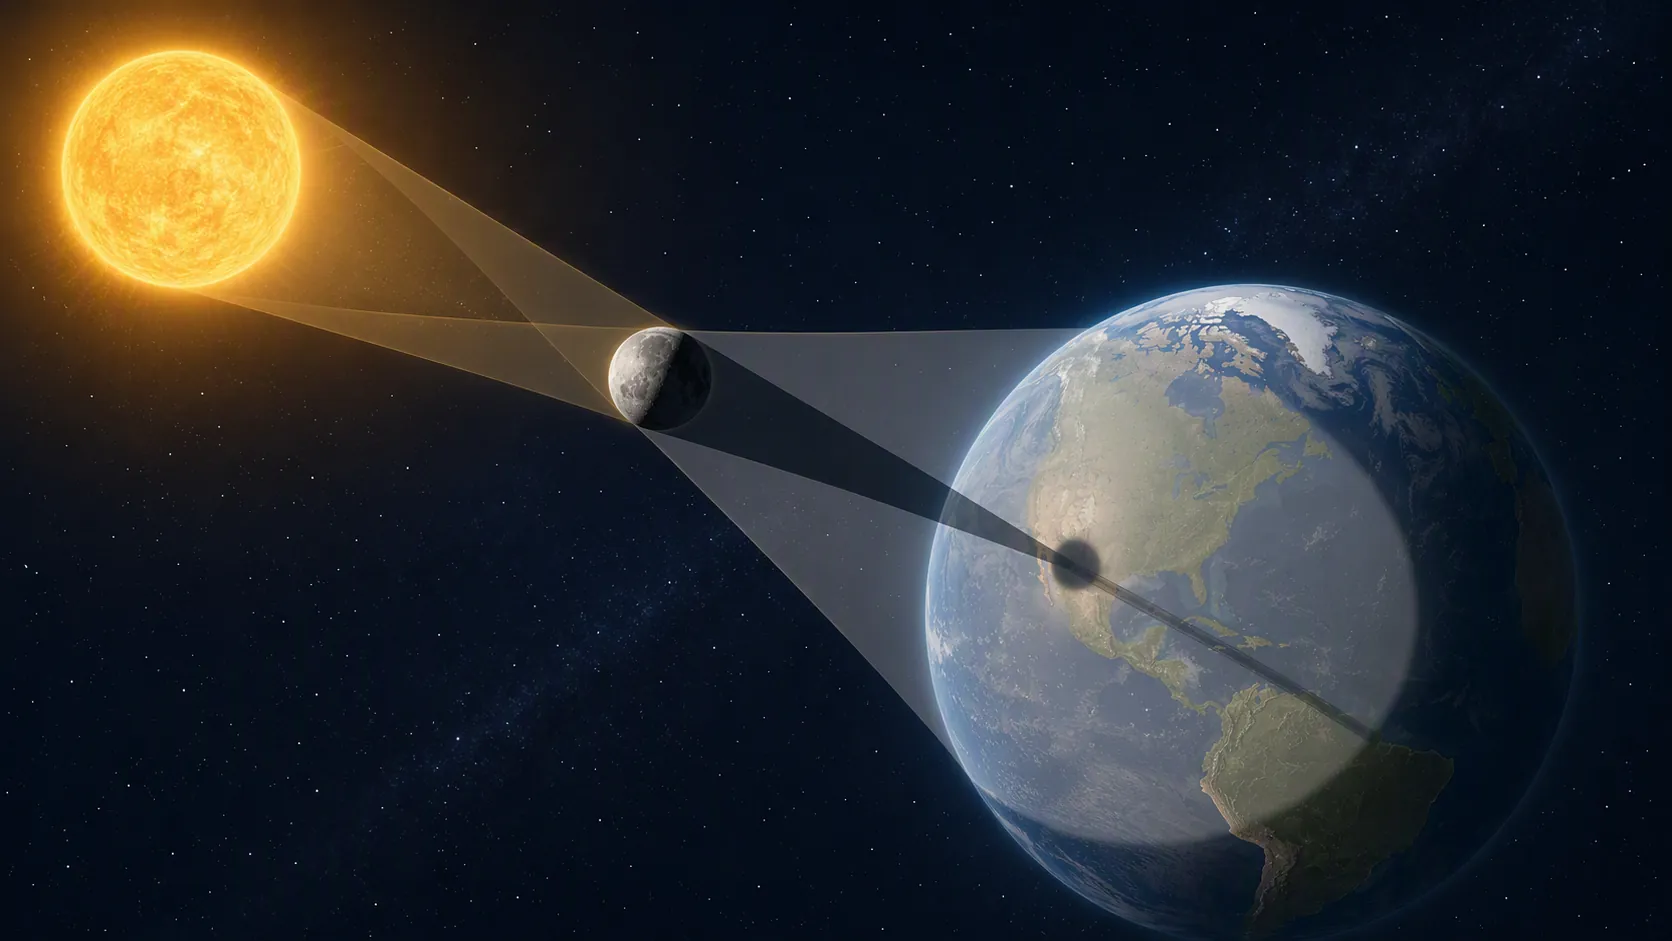
The first mistake on a 2027 eclipse path map is usually a quiet one: treating the colored band as if “near total” and “total” were versions of the same thing. They are not. The path of totality is the track made on Earth by the Moon’s umbra, the small, dark central shadow. The much wider penumbra produces a partial eclipse over a far larger region, but it does not produce totality outside the umbral track.[1][2]
For astronomy students, that is the load-bearing idea behind every line on the August 2, 2027 map. If a city is inside the umbral path, it can experience totality. If it is outside that path but inside the penumbral region, it gets a partial eclipse. A city showing 99.9% coverage is still outside totality if it is outside the umbra. That last tenth of a percent is not a rounding error; it is the difference between the Sun being fully covered and not fully covered.
Start with the shadow, then read the lines
On NASA’s interactive map for the August 2, 2027 total solar eclipse, the red line is the central line of the eclipse path, and the blue lines mark the northern and southern limits of totality.[3] Those colors are not decoration. The red line is where an observer is closest to the center of the umbral shadow as it passes. The blue boundary lines are the edges of the umbra’s track. Cross one of those limits and totality ends.
A separate set of lines and shaded regions belongs to partial eclipse visibility. Those belong to the penumbra, not the umbra. Space.com’s map-reading guide emphasizes that eclipse maps often combine totality-path information with partial-eclipse information, which is useful only if the reader keeps the two shadow regions separate.[2]
So the first question is not “How dark will it look?” or “What percent does this city get?” The first question is simpler: is the point inside the blue totality limits? If yes, then ask how close it is to the central line and what the local contact times are. If no, it is partial, no matter how close the percentage looks to 100.
The 2027 route gives you many real places to test
The August 2, 2027 eclipse is unusually good for map practice because its totality path crosses a long stretch of land. The path reaches land from the Atlantic, crosses the Strait of Gibraltar region, runs across North Africa through Morocco, Algeria, Tunisia, Libya, and Egypt, continues over the Arabian Peninsula and the Horn of Africa, and then exits over the Indian Ocean.[4][5]
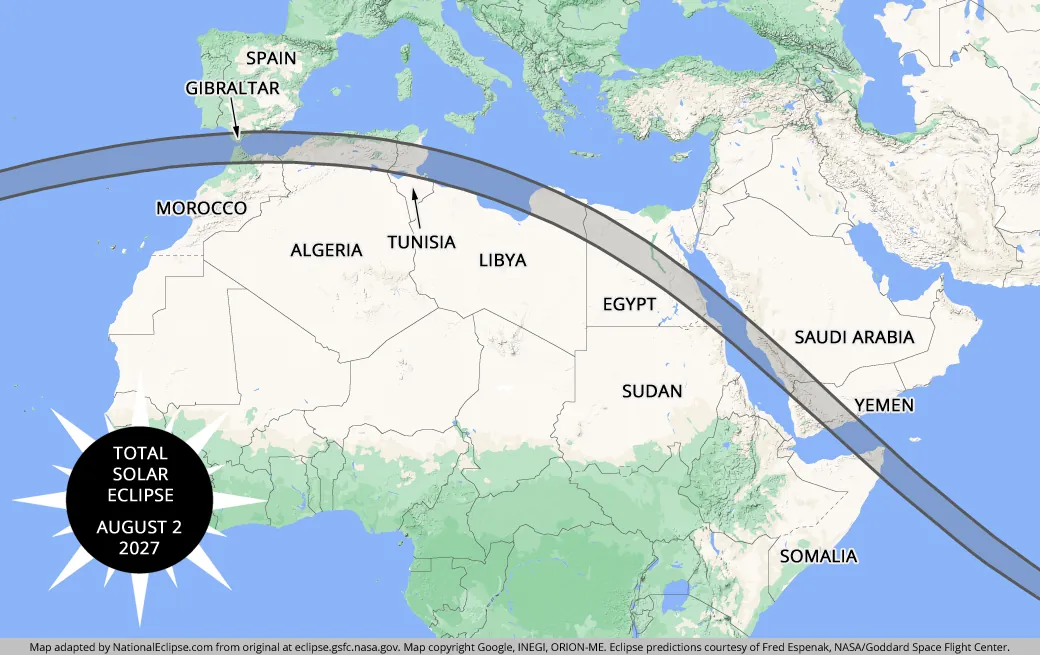
Sky & Telescope describes the eclipse path as crossing 15,227 km of Earth’s surface, and gives its widest point as 259 km.[5] Wikipedia gives the maximum width as 258 km.[4] That one-kilometer difference is not a crisis. It is a reminder that map products and prediction tables are computed products, not tablets handed down from orbit.
The same applies to duration. The maximum totality is often framed around roughly 6 minutes 23 seconds near the point of greatest eclipse in Egypt’s New Valley Governorate.[4] The National Solar Observatory gives 6 minutes 22 seconds near Luxor.[6] Those numbers are close enough to describe the same exceptional eclipse, but they are not interchangeable labels for every city in the path.
Inside the path is not the same as on the central line
Once a location is inside the blue limits, the next mistake is to stop reading. Being inside the path answers only one question: will the observer get totality? It does not answer how long totality will last.
Duration changes in two directions. Across the path, totality is longest near the central line and shrinks toward the northern and southern limits. Along the path, duration changes because the shadow geometry changes as the Moon’s umbra moves over Earth. The longest durations occur near the region of greatest eclipse, not simply anywhere along the colored band.
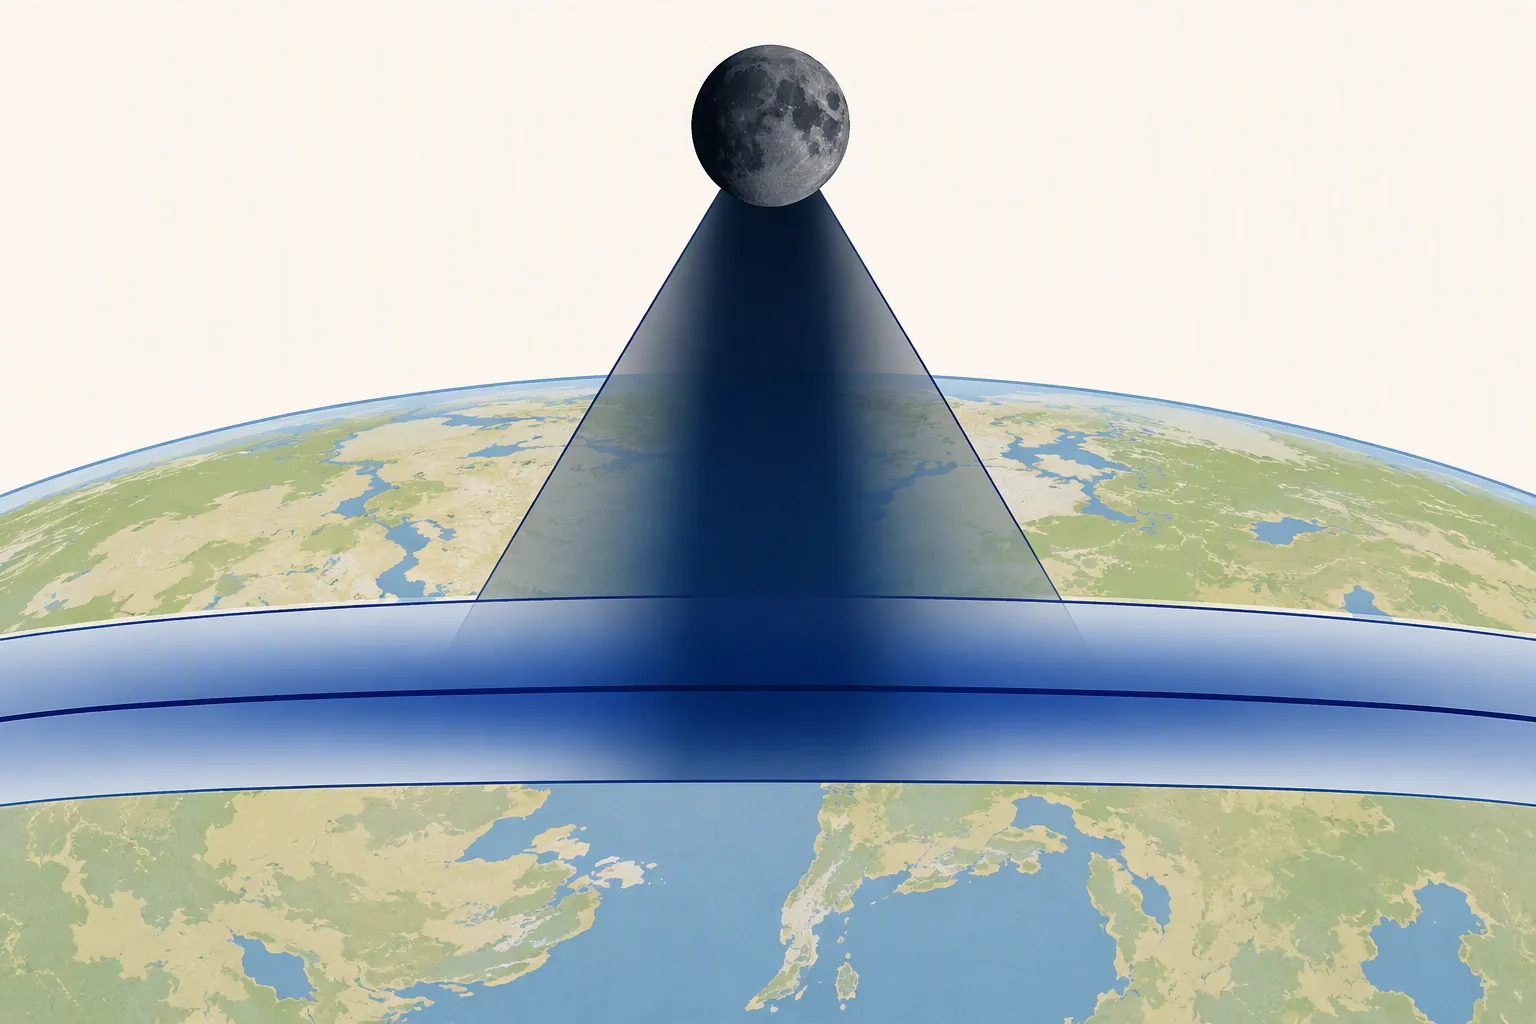
This is why Luxor, Benghazi, Sfax, Tangier, Gibraltar, Cádiz, and Málaga can all belong to the 2027 discussion while giving very different student answers. They are not equally placed inside the umbra. Some lie closer to the central line or nearer the long-duration part of the track; others sit nearer an edge or along a shorter-duration section.
| City or location | Published totality duration | What the number is useful for |
|---|---|---|
| Luxor | about 6m22s | A long-duration example near the strongest part of the event |
| Benghazi | 6m11s | Still very long, showing that the central North Africa route remains deep inside the path |
| Sfax | 5m41s | A strong totality example, but shorter than the Egyptian maximum region |
| Tangier | 4m51s | A western-path example where totality is real but not maximum |
| Gibraltar | 4m28s | Useful for reading the Strait of Gibraltar region rather than assuming all nearby cities match |
| Cádiz | 2m56s | A shorter totality example near the Spanish edge of the path story |
| Málaga | 1m57s | A near-edge lesson: inside the path can still mean brief totality |
Read that table as a diagnostic exercise, not as a sightseeing menu. The city name is less important than the city’s position relative to the red central line, the blue limits, and the region of greatest eclipse. A correct map reading explains why Málaga can be total and still have less than two minutes, while Luxor can be near six and a half minutes.
The Algiers problem: 99.9% partial is still partial
Algiers is the useful trap. Published descriptions put Algiers at about 99.9% coverage, while Madrid is around 86% and London around 42%.[2][4] Those percentages are partial-eclipse measures. They do not move the city across the blue totality limit.
For map reading, Algiers is not “basically total.” It is the example that proves whether a student has separated magnitude or obscuration from totality. If the umbra misses the observer, the solar photosphere is not fully covered. The sky experience, safety rules, contact sequence, and scientific label remain different from those for a city inside the path.
This is also where a static map can mislead. A printed path, especially at continental scale, may make a city look close enough. Close enough is not a category in eclipse geometry. The location is either inside the umbral limits or outside them.
What you can infer from a point on the map
If you point to a city on the 2027 eclipse map, you can infer only in stages. First, decide whether the city is in the partial-eclipse region at all. Second, decide whether it is inside the totality limits. Third, estimate whether it lies near the central line or near an edge. Only after that should you trust a duration table or click the interactive map for local circumstances.
- Inside the penumbra but outside the umbra: partial eclipse only.
- Inside the blue northern and southern limits: totality is possible at that location.
- Near the red central line: generally longer totality than a comparable point near the edge.
- Near the region of greatest eclipse: likely among the longest durations, but still verify the exact location.
- Near a boundary: seconds and local geography matter more, and a city label may not represent every observing site in that city.
That last point matters in coursework because a city name is rarely a point-sized observation site. A downtown coordinate, airport coordinate, riverbank, hilltop, or desert observing field can sit at slightly different positions relative to the shadow. If the assignment asks for contact times, use the coordinate or the map-click result, not the nearest famous city.
For background on the Sun-Moon-Earth alignment behind this geometry, the Moon phases study guide is the right companion. For a separate event used to practice the same eclipse-season and shadow concepts, see How the 2026 Solar Eclipse Teaches Students Astronomy.
Why different sources disagree by seconds
A student should not be surprised to see slightly different values for the same famous place. The sources themselves contain the warning. The 2027 maximum is commonly framed at about 6m23s near greatest eclipse, NSO gives 6m22s near Luxor, and Space.com gives a different Luxor value of 6m19s in its table.[4][6][2]
Those differences can come from the exact coordinate chosen, the prediction model, elevation handling, the lunar-limb profile, refraction assumptions, and ΔT assumptions. Photo Ephemeris notes that eclipse map limits may be computed for a smooth spherical Moon at sea level without refraction, while real observing sites and more detailed lunar-limb treatment can shift contact timing by seconds.[7]
This is not a reason to throw away the map. It is a reason to label your source. “Luxor: about 6m22s from NSO” is a better student answer than “Luxor: 6m22s” with no source. “NASA interactive map value for this clicked coordinate” is better still when the assignment asks for a location-specific result.
Use the interactive map before trusting a copied duration
The practical method is short. Open NASA’s interactive map for the August 2, 2027 eclipse. Find the city or observing site. Check whether the point is inside the totality limits. Compare its position with the central line. Then use the map’s local data rather than copying a duration from a screenshot or a travel graphic.[3]
If you are practicing for data-and-graph questions, the same discipline carries over: identify what each line measures before interpreting the number. The ACT Science eclipse-mapping article and exam-guide article use a different eclipse, but the chart-reading habit is the same.
And if this map reading turns into actual observing, safety is not optional. Outside the brief moments of totality, direct solar viewing requires proper protection; the safe eclipse glasses guide belongs beside the map, not after the trip is planned.
For the August 2, 2027 eclipse, the repeatable student behavior is this: do not stop at the colored band. Click or inspect the location, identify the umbra versus the penumbra, read the central line and limits, and attach every duration to the tool or table that produced it.
References
- Why Do Eclipses Happen? — NASA Science
- How to read and understand a solar eclipse map — Space.com
- Total Solar Eclipse of 2027 August 02 — NASA Eclipse Web Site
- Solar eclipse of August 2, 2027 — Wikipedia
- Plan for Next Year's Total Solar Eclipse: August 2, 2027 — Sky & Telescope
- August 2, 2027 Solar Eclipse Map — National Solar Observatory
- How to Read Solar Eclipse Maps — Photo Ephemeris
Related exhibits & inventory
Verified outcomes
No verified outcomes on file for this exam yet
See Methodology for how outcome evidence is disclosed once logged.
Planners
No planner filed for this exam yet
A downloadable timeline template for this exam hasn't been published yet.
Tool verdicts
AI-tool cautions
No AI tools tested for this exam yet
No hands-on AI-accuracy logs have been filed for this exam.
Questions about this plan
Ask a question about a specific section, timeline, or citation in this plan — or flag something that needs correcting.
Comments
Join the discussion with an anonymous comment.