
GRE Exam Hub
How Python-Hunting Apps Power Environmental Studies
This article explains how Florida's layered system of python-hunting apps — from the public reporting tool IveGot1 to the new UF predictive model — forms a documented citizen-science-to-management pipeline. Environmental studies students and GRE/MCAT test-takers can use this real-world case to understand multi-step science reasoning and data collection workflows.
- SAT
- ACT
- GRE
- MCAT
- ASVAB
- digital-sat
- adaptive-testing
- registration-fee
- content-outline
- score-target
A python hunting app for environmental studies is not useful because it makes invasive species work look tidy. It is useful because Florida’s Burmese python system is messy in exactly the way applied science is messy: a public sighting becomes a submitted record, the record has to be checked, professional crews add GPS tracks and removal data, and a newer model tries to forecast where and when search effort should go next.
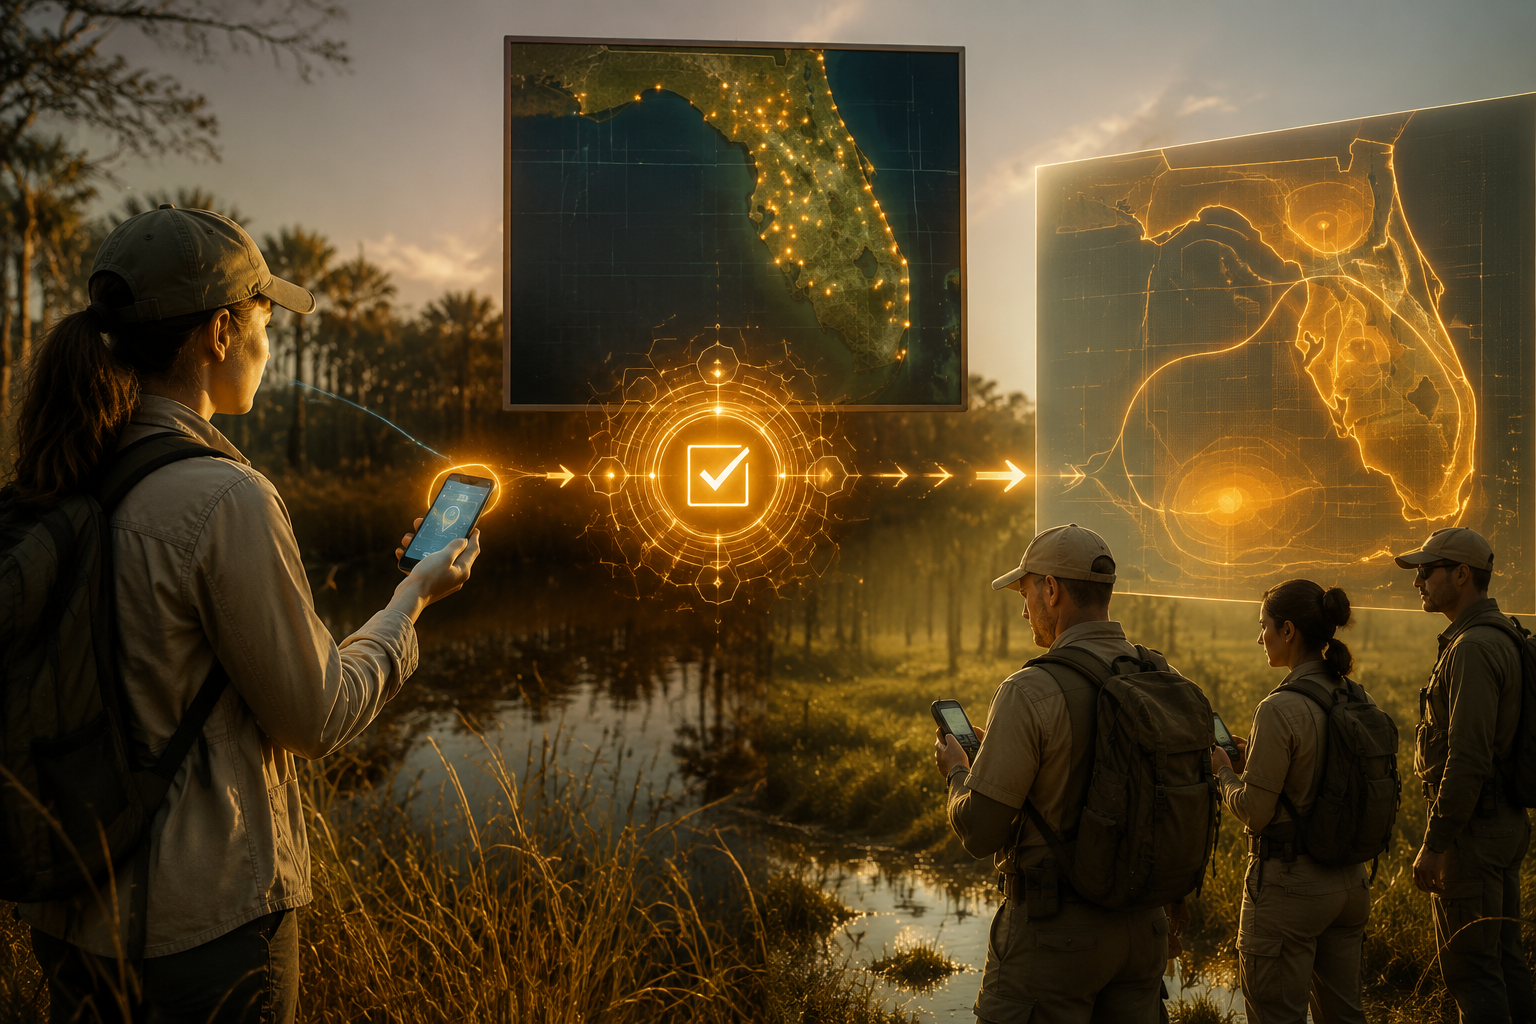
The current hook is the University of Florida forecasting app announced on July 21, 2026. The reported tool is built from a peer-reviewed study using 16,000 hours of GPS-tracked hunting data and is intended to predict better search windows and locations, including night hours, wet-season conditions, an August peak, and periods after barometric pressure drops.[1] That makes it timely, but not yet a mature public system with settled interface details or a long public-use record. As of today, it is better read as the newest layer in an older documented pipeline.
Why Florida Needed More Than One App
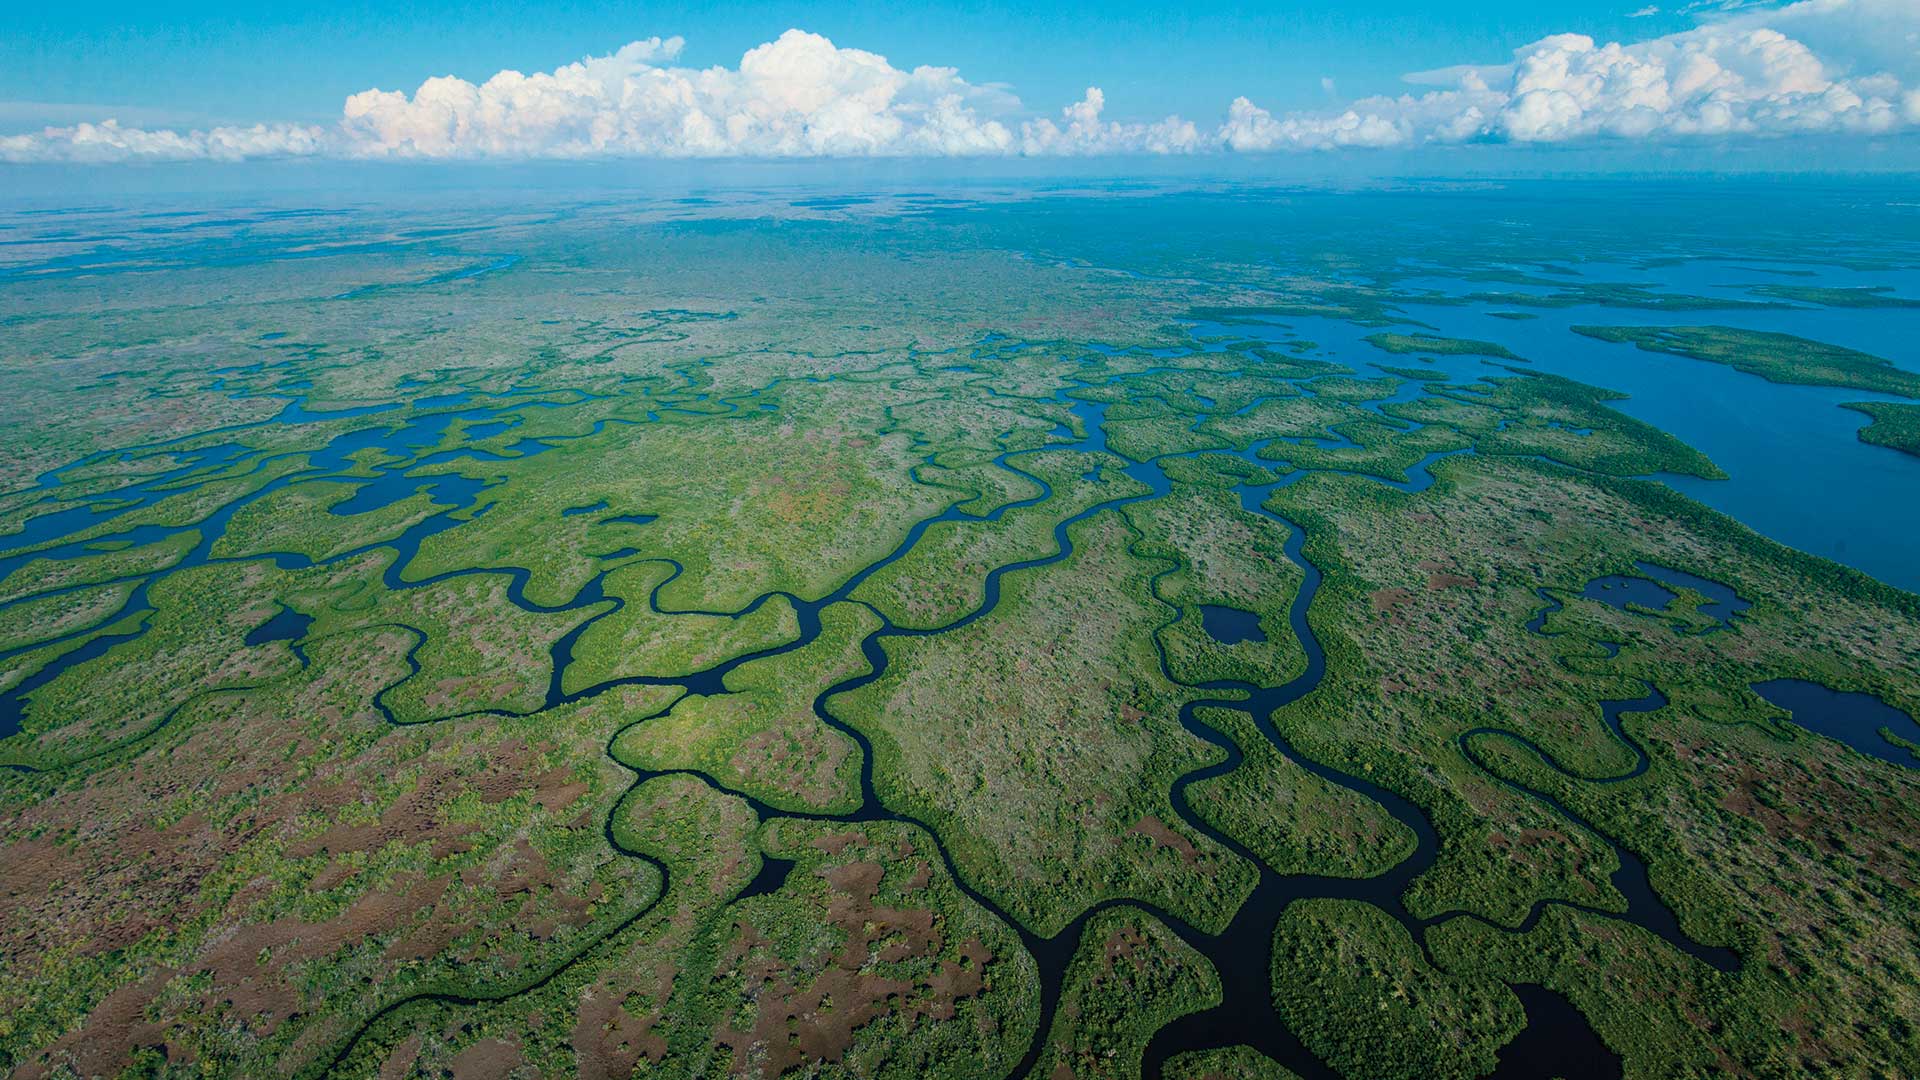
Florida’s Burmese python problem is large enough that a single reporting button would not carry the work. The Florida Fish and Wildlife Conservation Commission reports more than 23,500 pythons removed from Florida natural areas as of April 2025.[2] The South Florida Water Management District describes the python invasion as affecting about 1.7 million acres and cites an estimated economic impact of roughly $500 million per year.[3]
Those numbers matter for scale, not decoration. A student reading this as a science passage should ask what each number measures. A removal total is not the population size. An infested-acre estimate is not a count of animals. An economic-impact estimate is not a direct measurement of every ecological loss. Each figure belongs to a different part of the management argument.
That is why the app ecosystem is more interesting than the app label. Florida has public reporting, aggregation and verification, professional field collection, and now forecasting. Each layer answers a different operational question: Who saw something? Was the report usable? Where did trained searchers actually go? What did they remove? What pattern might guide the next search?
The Public Entry Point: IveGot1
IveGot1 is the public-facing start of the chain. The app launched on July 15, 2010, and is maintained by the University of Georgia Center for Invasive Species and Ecosystem Health. It connects public invasive-species sightings to EDDMapS and to the 888-Ive-Got1 hotline, moving reports toward the agencies and partners that can use them, including NPS, USGS, FWC, and SFWMD.[4]
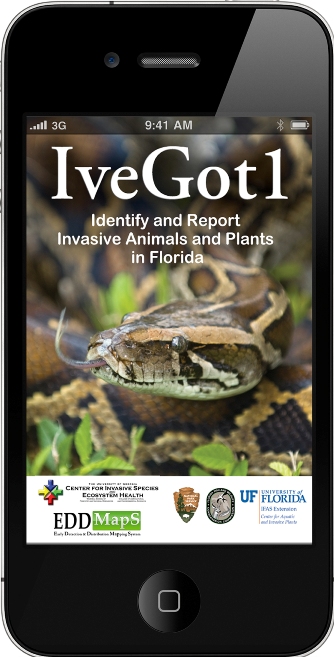
For environmental studies, the important feature is not that the public can tap a screen. The important feature is that the sighting enters a defined reporting route. A person sees a possible python, submits a location and other identifying information, and the record can be routed into a system where it is no longer just a story told on a roadside.
The Android listing for IveGot1 shows more than 10,000 downloads, which is an adoption signal, not an effectiveness measure.[5] A test passage could easily tempt readers to treat downloads as evidence that more pythons were removed. That conclusion would need another link in the chain: submitted reports, verified records, agency response, and documented outcomes.
EDDMapS Is the Layer Students Usually Skip
EDDMapS should not be treated as a spare acronym attached to IveGot1. It is the aggregation and verification layer that makes public reporting usable beyond the first submission. In a classroom diagram, IveGot1 is the front door; EDDMapS is where records can be organized, checked, mapped, and shared in a form closer to management evidence.[4]
This is the point where “citizen science” either becomes meaningful or turns into a pleasant label. A sighting from a member of the public is an observation. A verified, mapped record is a different object. It has passed through a transformation. The distinction is exactly the kind of distinction GRE and MCAT readers need to preserve when a passage moves quickly from field observation to institutional conclusion.
| Layer | Main input | Transformation | Output |
|---|---|---|---|
| IveGot1 | Public sighting or hotline report | Submission through a reporting route | Candidate invasive-species record |
| EDDMapS | Submitted records | Aggregation, mapping, and verification workflow | Agency-relevant occurrence data |
| ArcGIS Survey123 | Contractor tracks, search effort, removals, measurements | GPS logging and automated processing | Field collection and payment-support data |
| UF forecasting app | GPS-tracked hunting data from prior search effort | Predictive modeling | Suggested search times and locations |
Professional Field Data Has a Different Job
The contractor layer is where the case becomes more than a public-reporting story. The South Florida Water Management District Python Elimination Program and FWC’s Python Action Team Removing Invasive Constrictors use ArcGIS Survey123, adopted in 2018, to collect field data from contracted agents. The documented system includes GPS track logging and automated Python geoprocessing scripts used for invoicing, with about 100 contracted agents covering about 4 million acres across 11 counties.[6]
This is the part worth slowing down for. A contractor track is not the same kind of evidence as a public sighting. It records where search effort occurred, not merely where an animal was noticed. A removal record is different again. It connects a location, a person, a time, a snake, and often a measurement. If a program later asks whether search effort was effective, it needs both the places where pythons were found and the places where people searched without finding one.
The payment system helps explain why the data structure matters. SFWMD describes contractor pay as hourly compensation of $14 to $30 per hour, plus $50 per python and $25 per foot beyond four feet.[3] That does not make the program merely administrative. It means route records, python measurements, removals, and invoices have to agree closely enough for public funds and management claims to stand on the same file trail.
The Esri account reports about 12,000 removals through the SFWMD and FWC contractor system since 2017.[6] That figure should not be collapsed into FWC’s broader 23,500-plus removal total as if they describe the same population and time window. One refers to the contractor system; the other is a larger statewide removal statement. On exams, this is a classic trap: two impressive numbers appear near each other, but they are not interchangeable.
The UF Forecasting App Turns Search History Into Prediction
The July 2026 UF forecasting announcement adds the predictive layer. The reported model uses 16,000 hours of GPS-tracked hunting data to identify better search times and locations, including 8 p.m. to 2 a.m., the May-to-October wet season, an August peak, and conditions after barometric pressure drops.[1] The point is not that a model magically finds snakes. The point is that prior search effort becomes training material for future search decisions.
That changes the reading task. Earlier layers ask whether a report can be trusted and used. The forecasting layer asks whether patterns in past effort can help allocate future effort. A model built from GPS-tracked hunting data inherits the strengths and limits of those tracks. It can learn from where searchers went, when they searched, and what they found; it cannot automatically represent every unsurveyed place with equal confidence.
A Short Comparison: Scout Snakes as Another Data-Rich Method
Not every useful python-management method is app-centered. The Conservancy of Southwest Florida’s scout snake program uses radio-tagged male pythons tracked by telemetry. In its 2025–2026 season, the program reported 40 radio-tagged males, 177 pythons removed, 8,080 pounds of python biomass, an average female weight of 95 pounds, and 4,100 eggs removed from a 200-square-mile area in Collier County.[7]
This method belongs in the same environmental studies conversation because it also turns animal movement and field detection into management data. It does not replace the app pipeline. It gives students a useful comparison: telemetry follows selected tagged animals, while reporting and contractor systems collect sightings, search tracks, removals, and measurements across broader management programs.
How to Read This Case Like a GRE or MCAT Passage
For students using this case through a GRE study plan or an MCAT prep workflow, the right habit is to mark the role of each data stream before answering any interpretation question. Public sightings, verified records, contractor GPS tracks, removals, measurements, invoices, telemetry, and model predictions are not one pile of “python data.” They are different evidence types produced by different actors.
- Identify the source: a resident, hotline caller, contractor, agency staff member, tagged animal, or model.
- Separate observation from verification: a submitted sighting is not yet the same as an agency-ready record.
- Separate intervention from monitoring: a removal count records action, while a GPS track can also record effort where no python was found.
- Watch time windows: 2010 launch dates, 2017 contractor totals, April 2025 removal totals, 2025–2026 scout-snake results, and the July 2026 UF announcement do not describe one identical period.
- Distinguish adoption from effectiveness: app downloads and program participation show use, not automatically ecological impact.
A hypothetical exam question might say that a forecasting model recommends searching after a pressure drop, then ask what additional information would best test whether the recommendation improves removals. The strongest answer would not be “more downloads.” It would look for comparable search effort, locations, timing, and removal outcomes before and after the recommendation is used. The app is not the independent variable by itself; the changed search allocation is.
Another hypothetical question might ask why contractor GPS tracks matter if removal locations are already recorded. The answer is that removals alone hide unsuccessful search effort. Without tracks, a map can overrepresent where snakes were found and underrepresent where trained crews looked and found none. That missing denominator is where many rushed science readers lose the passage.
What This Case Teaches
Florida’s python app ecosystem is a strong environmental studies case because it connects citizen science, GIS field collection, invasive species management, contractor accountability, telemetry, and predictive modeling. Its value is not in memorizing that IveGot1 exists or that a new UF app was announced in 2026. Its value is in following the chain of custody: who produced the record, how it was checked, how it shaped action, and what later systems can learn from it.
Read that chain carefully and the case becomes a compact model of applied environmental reasoning. Read it as a list of app names and headline counts, and it becomes another set of flashcards that will not survive a well-written passage.
References
- Florida works on new app to find Burmese pythons for Python Challenge — Naples Daily News, July 21, 2026
- Python Action Team Removing Invasive Constrictors (PATRIC) — Florida Fish and Wildlife Conservation Commission
- Python Elimination Program — South Florida Water Management District
- Need to identify a python? There's an 'app' for that — UGA CAES Field Report
- IveGot1 — Google Play
- South Florida Geospatial Team Advances Everglades Python Removal Program — Esri industry blog
- Record python removal season highlights Conservancy's science-based efforts — Conservancy of Southwest Florida, June 2026
Related exhibits & inventory
Verified outcomes
Planners
No planner filed for this exam yet
A downloadable timeline template for this exam hasn't been published yet.
Tool verdicts
AI-tool cautions
No AI tools tested for this exam yet
No hands-on AI-accuracy logs have been filed for this exam.
Questions about this plan
Ask a question about a specific section, timeline, or citation in this plan — or flag something that needs correcting.
Comments
Join the discussion with an anonymous comment.