
GRE Exam Hub
Why Oil Hit $100 After Red Sea Attacks: An Economics Lesson
This article explains why the Houthi Red Sea blockade pushed Brent crude past $100/barrel in July 2026, and shows how this chain of events—a negative supply shock amplified by inelastic demand and dual chokepoint closure—forms a causal structure repeatedly tested in GRE Analytical Writing, MCAT CARS, and AP/IB Economics.
- gre
- mcat
- asvab
- sat
- act
- digital-adaptive
- official-material
- section-strategy
- test-date-timeline
If this appeared as a timed exam prompt, the trap would be treating the July oil move as market drama. Brent crude did not simply “react to tension.” It hit $100.07 on July 23, 2026, after Houthi strikes on two Saudi tankers, Encelia and Layla; the move was a 6.38% single-day surge and part of a 33% monthly rise.[1][2] The useful question is why oil prices hit $100 after Red Sea attacks: the economics lesson is a negative supply shock amplified by inelastic demand and by the loss of the normal rerouting path.
That sentence already contains the exam answer. A shock reduced or threatened available supply. Buyers could not quickly reduce oil use. The market therefore had to ration a smaller expected supply through a much higher price. What made July 2026 sharper than an ordinary shipping-risk story was the route sequence: one chokepoint had already been mostly removed, so the attack on the workaround mattered much more than it would have in isolation.
The price spike is the outcome, not the explanation
A clean analytical paragraph should not begin with “oil is important” or a long detour through Middle East politics. Begin with the observed price movement, then name the mechanism. The July 23 tanker strikes changed expectations about how much crude could physically reach buyers, and those expectations were already strained because the Strait of Hormuz had been near-totally closed since March 2026.[1]
In supply-and-demand terms, the immediate story is a leftward shift of short-run oil supply. The more exam-ready version is slightly more specific: a geopolitical disruption threatened transport capacity, not just production capacity. Crude that exists underground or in storage is not economically equivalent to crude that can reach refineries on schedule. When a shipping route closes, available supply at the destination can fall even before wells stop pumping.
That distinction matters because many weak answers jump from “attack” to “price increase” without identifying what became scarce. The scarce thing was not oil in the abstract. It was reliable, near-term deliverable crude moving through the remaining maritime pathway.
Why the second chokepoint mattered more than a single attack
The most important part of the July 2026 case is the dual-chokepoint cascade. A single blocked route is serious; a blocked route plus a threatened workaround is a different economic event.
Under normal conditions, the Strait of Hormuz is one of the central arteries of the oil market. The July reporting described it as normally handling roughly 20 million barrels per day, about 20% of global oil, with 130 to 140 ships per day passing through.[1] Once Hormuz had been near-totally closed since March 2026, Saudi Arabia redirected more than 70% of its crude, about 4.5 million barrels per day, by pipeline across the country to the Red Sea port of Yanbu.[1]
That pipeline redirect was the workaround. It meant crude that could no longer move through Hormuz could still reach the Red Sea, then move north or south through routes connected to the Bab el-Mandeb and the wider Red Sea shipping lane. Then came the Houthi blockade declaration on July 20 and the tanker strikes on July 23.[1][2] The market was no longer pricing a problem at the original chokepoint. It was pricing the possibility that the workaround had become unsafe too.
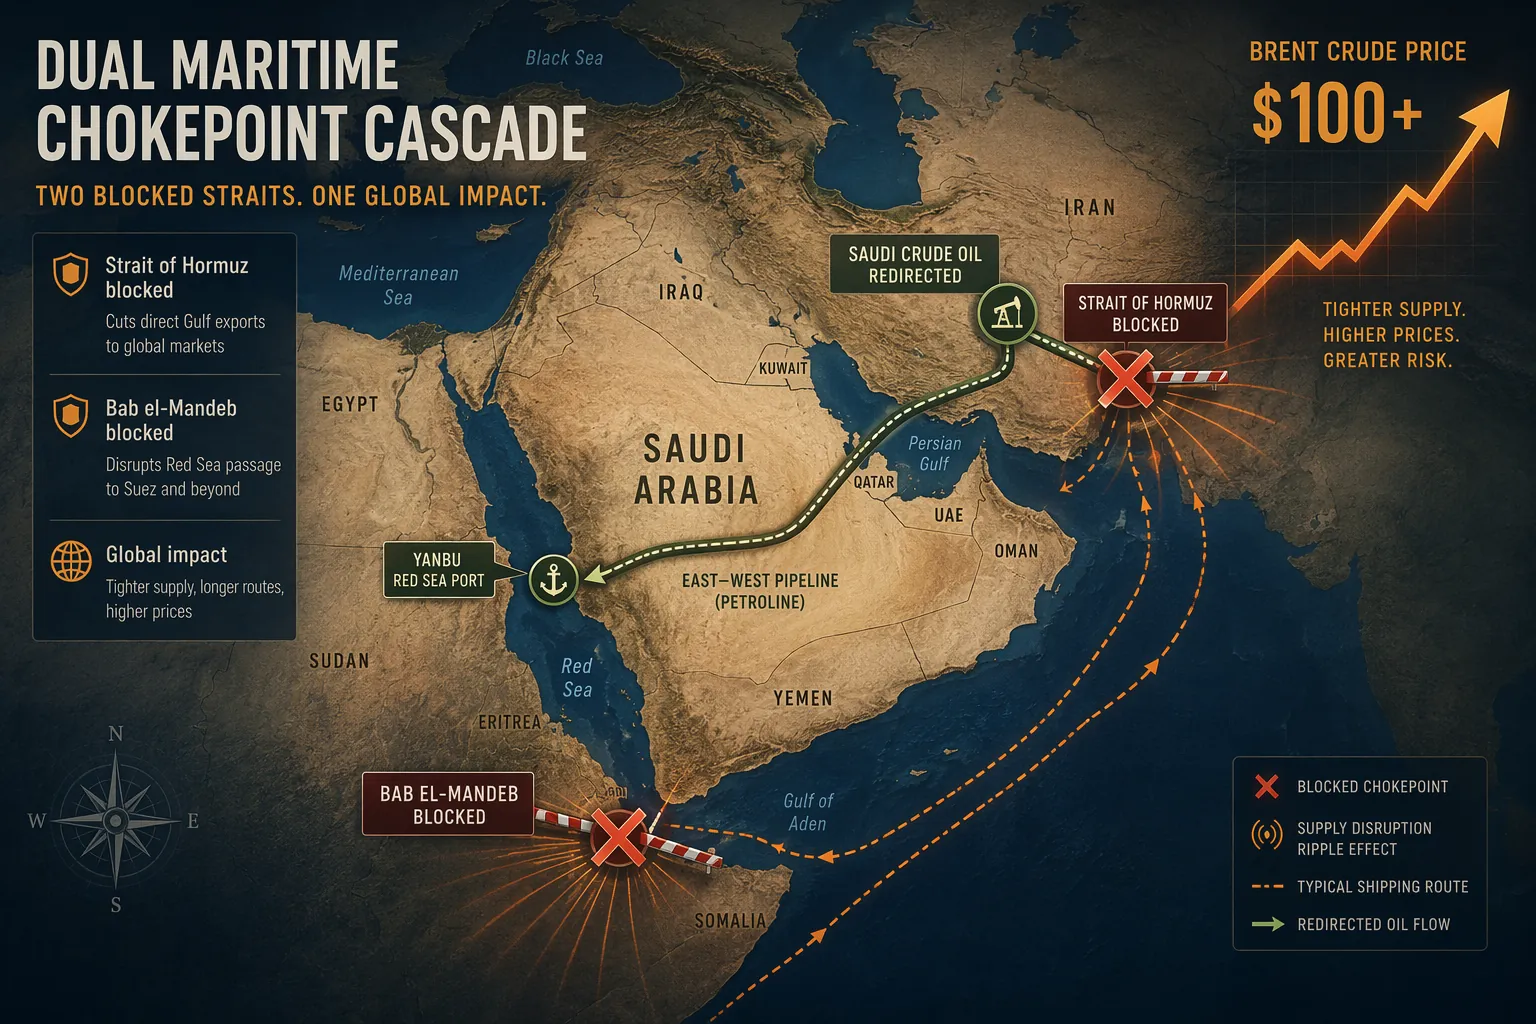
For a test-taker, this is the paragraph to slow down on. The phrase “Red Sea attacks” is too broad by itself. The causal force comes from sequence:
- Hormuz, a normal high-volume oil route, was already near-totally closed.
- Saudi crude was redirected across land to Yanbu on the Red Sea.
- The Red Sea route then became threatened by blockade and tanker strikes.
- The market had to reprice oil as if rerouting capacity had narrowed sharply.
This is why the event is stronger than a generic “political instability raises prices” example. Political instability can raise risk premiums, but a chokepoint cascade changes the physical constraint. If the first route is closed and the second route is threatened, the buyer cannot simply point to another line on the map and assume the same barrels arrive.
Inelastic demand turns a supply loss into a large price move
The next link is elasticity. Short-run oil demand is highly inelastic: consumers, airlines, freight companies, factories, and utilities cannot instantly redesign commutes, fleets, production schedules, or fuel systems because the price changed this week. A standard textbook range for short-run oil demand elasticity is approximately −0.05 to −0.1, which means the quantity demanded falls only slightly when price rises.
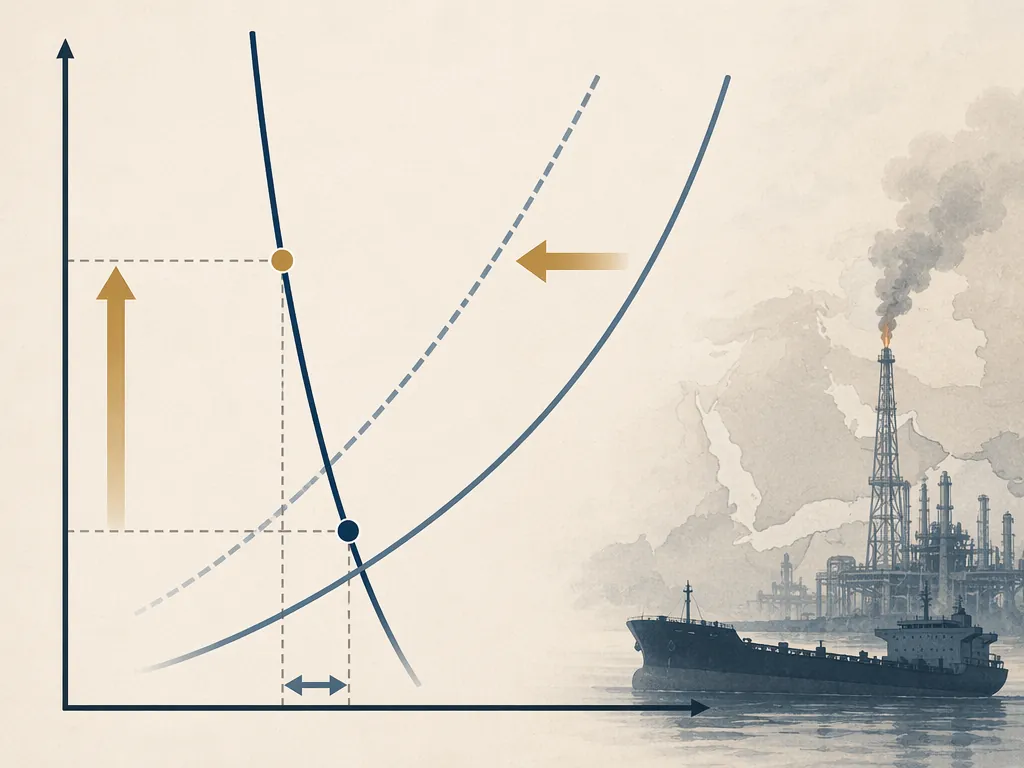
That does not mean one can mechanically calculate the July 23 Brent price from a single elasticity figure. Real prices include inventories, futures expectations, refinery demand, policy signals, insurance costs, and traders’ beliefs about duration. But the direction and disproportion are exactly what the model predicts. When demand is steep, a small leftward shift in available supply produces a large vertical movement in price.
A rough classroom version helps, as long as it is labeled as hypothetical. Suppose a necessary fuel market loses a small share of deliverable supply for the next month, and buyers can reduce use only a little in that time. Price must rise enough to force rationing among buyers who still need the product. The key is not that every buyer refuses to adjust; it is that aggregate adjustment is slow.
| Exam phrase | What it should mean in this case |
|---|---|
| Negative supply shock | A disruption reduced or threatened deliverable oil supply by making a transport route unsafe. |
| Inelastic demand | Quantity demanded could not fall quickly enough to absorb the disruption without a large price increase. |
| Chokepoint cascade | Hormuz was already closed or nearly closed, so the Red Sea route was not just one route among many; it was the workaround. |
| Price transmission | Higher crude prices increased costs for transport, goods movement, production, and eventually inflation-sensitive sectors. |
What analysts were really pricing
The analyst comments around July 2026 fit this mechanism better than they fit a pure panic story. OilPrice.com reported before the $100 print that the Houthi Red Sea blockade could undermine hopes for lower oil prices, with ING and Energy Aspects pointing to a tightening physical market as the Red Sea route came under threat.[3] That wording is important: a “tightening physical market” is not the same as a vague fear premium. It means less slack, fewer easy substitutes, and less confidence that barrels can be moved around disruptions.
Stratas Advisors’ warning that the combined chokepoint disruption could produce a global recession if sustained belongs in the same chain.[3] It is not proof that a recession must follow; it is a statement about risk conditional on duration. In exam writing, that distinction matters. A temporary price spike and a sustained supply restriction have different macroeconomic consequences.
How the oil shock becomes an inflation problem
Once the price mechanism is clear, the macroeconomic transmission is straightforward. Oil is an input into transportation, shipping, chemicals, agriculture, manufacturing, and household energy costs. A crude price spike can therefore move beyond gasoline headlines into the cost structure of goods.
The cleanest evidence here comes from earlier disruption studies, but they need careful labeling. In February 2024, J.P. Morgan Research estimated that the Red Sea shipping crisis could add 0.7 percentage points to global core goods inflation and 0.3 percentage points to overall core inflation.[4] Those estimates were not written for the July 2026 dual-chokepoint case. They are better used as lower-bound context: even a less severe Red Sea disruption was expected to push measurable inflation pressure through goods prices.
CEPR/VoxEU’s April 2024 analysis of Red Sea disruptions also belongs in that narrower category. Its modeling considered short-lived and more protracted disruption scenarios under assumptions tied to the 2024 shipping crisis, including a return toward normal by the end of 2024.[5] That makes it useful precedent for how shipping disruptions transmit into trade costs, delays, and price pressure, not direct proof of the size of the 2026 effect.
The AP/IB Economics version is cost-push inflation: higher input costs shift short-run aggregate supply left, raising the price level and reducing real output, all else equal. The GRE or MCAT version is causal discipline: do not stop at “conflict caused inflation.” The intermediate steps are transport disruption, reduced deliverable supply, higher energy prices, higher production and shipping costs, then inflation pressure and possible output loss.
The same chain works across GRE, MCAT, and AP/IB prompts
Different exams would hide the same structure under different language. A GRE Analytical Writing prompt might ask whether governments should intervene when global markets are exposed to geopolitical risk. A strong response would not merely cite oil at $100; it would explain why the example shows vulnerability created by concentrated transport routes and inelastic demand.
An MCAT CARS passage might never ask for a supply curve at all. It might ask which inference is best supported, which claim overreaches, or why a commentator’s conclusion is too strong. The correct reader would separate risk from realized damage, temporary disruption from sustained constraint, and lower-bound analogy from direct evidence. J.P. Morgan’s 2024 estimates, for example, support the claim that shipping disruption can add inflation pressure; they do not by themselves quantify the July 2026 inflation outcome.[4]
An AP or IB Economics free-response question would likely be more explicit. It might ask students to draw a market diagram for oil after a supply disruption, explain why price rises more when demand is inelastic, and then show a macro diagram for cost-push inflation. The July 2026 case gives students one continuous example instead of three disconnected vocabulary terms.
A compact exam paragraph
The July 2026 oil spike illustrates a negative supply shock because attacks on Red Sea shipping threatened the route Saudi Arabia was using after the near-total closure of Hormuz. Since short-run oil demand is highly inelastic, consumers and firms could not quickly reduce usage enough to offset the threatened supply loss, so prices had to rise sharply to ration available barrels. The shock then transmitted into the wider economy through higher transport and production costs, increasing inflation pressure and, if sustained, recession risk.
That paragraph is deliberately plain. It does not predict next week’s oil price, name every actor, or turn the event into a slogan. It follows the links that matter under time pressure: shock, inelastic demand, chokepoint cascade, price spike, macro transmission.
The reusable lesson
The $100.07 Brent price on July 23 was the visible result of a tightened causal chain.[1] Hormuz had already been largely removed from normal routing. Saudi crude had been redirected to Yanbu. The Red Sea route then came under blockade and attack. Demand could not adjust quickly. Analysts saw the physical market tightening, and earlier Red Sea disruption research showed how shipping shocks can feed inflation pressure.[3][4][5]
When a shock hits a necessary good with inelastic short-run demand, and when normal rerouting capacity has already been removed, a sharp price move is not random panic. It is the market’s way of rationing scarce deliverable supply. That is the structure to recognize, whether the passage is about oil, food, semiconductors, shipping lanes, or any other necessary input moving through a fragile bottleneck.
References
- Oil tops $100 for first time since May after Houthi tanker strikes, Trump threats, Al-Monitor, July 2026
- Oil nears US$100 as Houthi attacks in Red Sea amplify supply risks, Financial Post, July 23–24, 2026
- Houthi Red Sea Blockade Could Shatter Hopes for Lower Oil Prices, OilPrice.com, July 22, 2026
- Red Sea shipping crisis inflation estimates, J.P. Morgan Research, February 2024
- Sailing through storms: The fallout of Red Sea disruptions, CEPR/VoxEU, April 2024
Related exhibits & inventory
Verified outcomes
Planners
No planner filed for this exam yet
A downloadable timeline template for this exam hasn't been published yet.
Tool verdicts
AI-tool cautions
No AI tools tested for this exam yet
No hands-on AI-accuracy logs have been filed for this exam.
Questions about this plan
Ask a question about a specific section, timeline, or citation in this plan — or flag something that needs correcting.
Comments
Join the discussion with an anonymous comment.