
SAT Exam Hub
How Fast Is India's Data Center Infrastructure Growing?
India's data center capacity roughly tripled from 2020 to 2025, yet published figures conflict on scope and cutoff dates. This source-labelled case study for students maps the growth, geography, and committed investment, and shows how to reconcile competing industry numbers.
- gre
- mcat
- asvab
- sat
- act
- digital-adaptive
- official-material
- section-strategy
- test-date-timeline
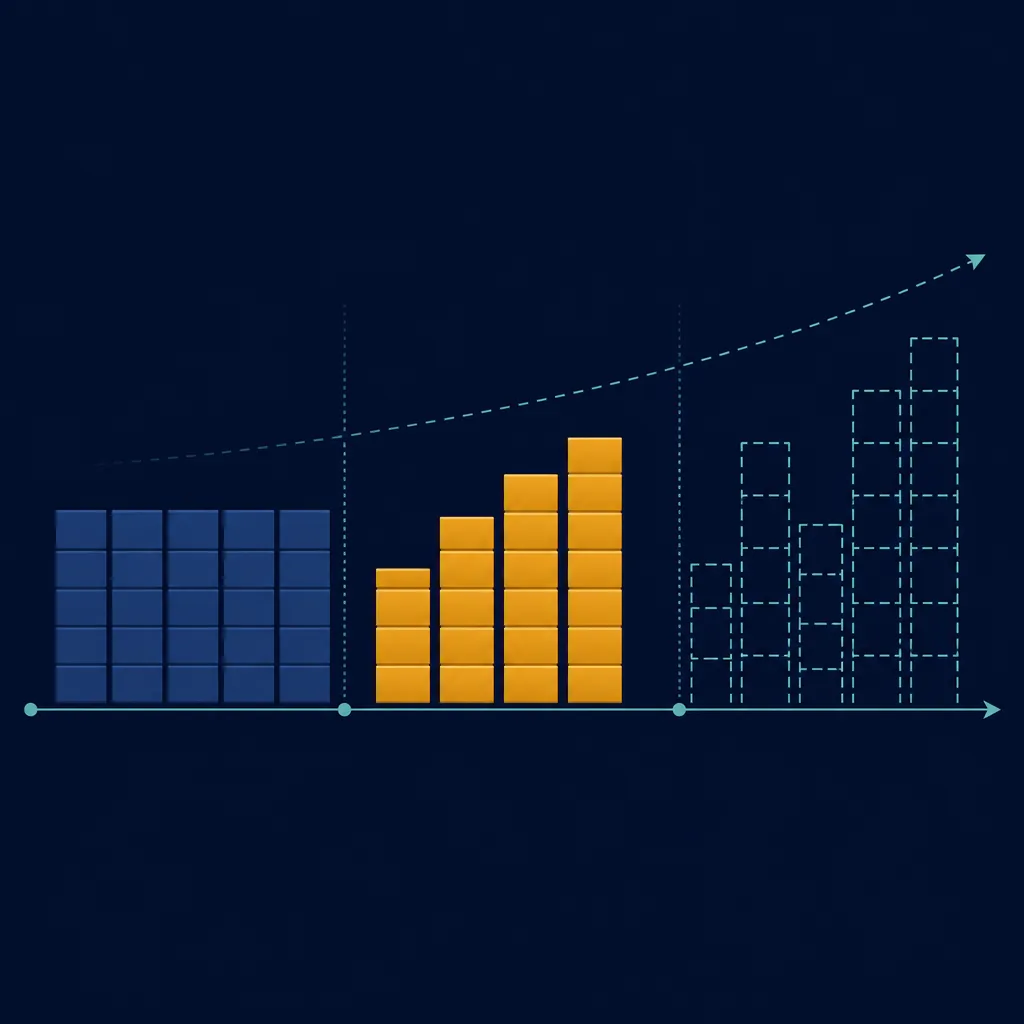
India’s data center infrastructure grew from roughly 520 MW in 2020 to about 1.5 GW around 2025—close to a tripling in five years.[1] That is the defensible headline. The exact size at any point in 2025 is less certain because industry reports use different observation dates and may not apply identical definitions of inventory, operational stock, or total capacity.
Evidence box: the growth record at a glance
Reviewed in Q3 2026. Historical capacity, investment commitments, and forecasts are kept separate because they measure different things.
| Indicator | Reported figure | How to classify it |
|---|---|---|
| India data center capacity, 2020 | Approximately 520 MW [1] | Historical capacity baseline |
| India data center capacity, around 2025 | Approximately 1.5 GW in the CEEW growth curve [1] | Dated capacity estimate, not a universal market total |
| Investment commitments, 2019–9M 2025 | Approximately US$94 billion across market participants [2] | Cumulative commitments, not installed capacity or completed spending |
| Capacity outlook for 2030 | Approximately 4.5–6.5 GW [1] | Forecast range, not infrastructure already built |
Why do credible 2025 capacity figures disagree?
A student researching the market can quickly encounter two apparently incompatible claims. JLL reported 1,123 MW of inventory for H1 2025.[3] CBRE subsequently reported approximately 1,530 MW of operational stock for the first nine months of 2025, covering about 23 million square feet.[2] Treating one as correct and the other as an error would skip the most important analytical step.
| Source | Observation period | Published measure | Figure | What must stay attached |
|---|---|---|---|---|
| CEEW | 2020 | Capacity baseline | Approximately 520 MW [1] | The baseline year and source |
| JLL | H1 2025 | Inventory | 1,123 MW [3] | H1 cutoff and the term “inventory” |
| CEEW | 2025 | Capacity in its growth curve | Approximately 1.5 GW [1] | The curve’s year and measurement context |
| CBRE | 9M 2025 | Operational stock | Approximately 1,530 MW [2] | Nine-month cutoff and “operational stock” scope |
| Blackridge Research | 2025 snapshot published in its Q1 2026 report | Market capacity estimate | Approximately 1.52 GW [4] | Retrospective snapshot and report methodology |
The cutoff dates differ first. JLL’s figure stops at H1, while CBRE’s covers nine months. CBRE says that 260 MW was added during those nine months, so a later snapshot should not automatically match an earlier one.[2] Timing can therefore explain part of the gap.
The measurement labels differ as well. JLL calls its figure inventory; CBRE calls its figure operational stock. Other publications may refer to total capacity, installed capacity, live IT load, planned supply, or a mixture of operational and under-construction facilities. These terms cannot be assumed to share one denominator merely because they are all expressed in megawatts.
The available figures do not provide a complete project-by-project bridge from JLL’s 1,123 MW to CBRE’s approximately 1,530 MW. It would therefore be too strong to say that timing and definitions explain every megawatt of difference. The narrower and better-supported conclusion is that the figures represent separately dated, differently labelled market snapshots.
A reproducible method for comparing reports
Before placing a market figure in an assignment, record four fields beside it:
- Source: identify the institution or report rather than writing “industry estimates.”
- Observation date: distinguish H1, nine months, calendar year-end, and publication date.
- Measurement label: preserve terms such as inventory, operational stock, capacity addition, take-up, commitment, and forecast.
- Scope: check whether the figure covers live facilities, projects under construction, selected cities, particular operators, or the national market.
Only figures with compatible fields should be used to calculate growth. If the definitions remain uncertain, retain the estimates side by side and explain why they differ. Averaging them would create a number that no source actually measured.
From 520 MW to the 2025 capacity cluster
With that caution in place, the direction and scale of change are clear. CEEW’s evidence chain places capacity at about 520 MW in 2020 and around 1.5 GW in 2025.[1] The endpoint is best read as an approximate market level rather than an exact census, but it indicates that capacity became nearly three times as large over the period.
JLL’s operating indicators show that the expansion was accompanied by demand. Net take-up reached 97.9 MW in H1 2025, up 48% year over year, while vacancy stood at 4.3%.[3] Take-up is a flow during a period; vacancy is a share of available inventory at a point or reporting period. Neither should be substituted for the total national capacity figure.
Facility counts tell another part of the story. CEEW reported approximately 271 data centers as of January 2026.[1] A center count cannot be converted mechanically into megawatts because facilities vary in size. One large campus and one small edge facility each count as a single center, even though their power capacity may be substantially different.
This distinction is useful in exams: capacity measures the scale of infrastructure more directly, while the number of centers describes the distribution of physical sites. A strong answer can use both, provided it does not treat them as interchangeable.
Growth is concentrated in four metropolitan hubs

National growth has not been geographically even. CBRE estimated that roughly 90% of India’s capacity was concentrated across Mumbai, Chennai, Delhi-NCR, and Bengaluru in its 9M 2025 assessment.[2] This makes the build-out a metropolitan infrastructure story as much as a national one.
Mumbai was the leading hub, but even its share changes with the dataset. JLL assigned Mumbai 54% of capacity in H1 2025.[3] Blackridge Research’s alternative 2025 snapshot placed the city at approximately 46.5%.[4] The difference should trigger the same scope-and-date check used for national capacity, not an immediate judgment that one source is wrong.
It would also be misleading to apply both percentages to a capacity total taken from a third report. For example, multiplying JLL’s Mumbai share by CBRE’s national stock would combine different datasets and could produce a city estimate that neither organization published. A defensible calculation keeps a source’s numerator and denominator together.
The four-hub pattern matters because capacity additions bring local consequences. Power availability, network connectivity, land, approvals, cooling requirements, and water conditions are experienced at the city and site level. These issues deserve policy attention, but the supplied evidence does not support a single national claim about their effects. They should therefore be investigated locally rather than appended as an assumed cost of every facility.
What the US$94–95 billion figure actually measures
CBRE reported approximately US$94 billion in investment commitments across market participants from 2019 through the first nine months of 2025.[2] CEEW presents the same broad expansion at roughly US$95 billion.[1] These are rounded, cumulative commitment snapshots, not two separate pools of money to be added together.
A commitment also does not prove that the entire amount has already been spent, that every announced project is operational, or that the money translates into a fixed number of megawatts. Project schedules, construction stages, land, equipment, and associated infrastructure can all sit within an investment program. The capacity figures and the commitment total therefore answer different questions.
| Measure | Question it answers | What it does not establish |
|---|---|---|
| Operational capacity or stock | How much measured infrastructure is live within the report’s scope? | How much may be completed later |
| Capacity addition | How much capacity entered the measured stock during a period? | Total market size by itself |
| Net take-up | How much space or capacity was absorbed during the period? | Total installed capacity |
| Investment commitment | How much capital participants have announced or allocated within the stated scope? | That all capital has been spent or all projects completed |
| Forecast capacity | What future scale does a model or report consider possible? | Infrastructure already constructed |
Company announcements and hyperscaler-only totals are narrower subsets or differently framed snapshots. They should be presented under their own dates and scopes, not added automatically to CBRE’s all-player cumulative commitment figure. Otherwise, the same planned capital may be counted twice.
GRI Institute offered another time-framed investment picture in its 2026 strategic report: approximately US$30 billion in 2025 and more than US$100 billion by 2027.[5] The latter is forward-looking. It should not be rewritten as money already invested, nor added to the US$94 billion historical commitment snapshot without confirming whether their scopes overlap.
Operators, national demand, and the global capacity gap
The operating market includes STT, NTT, Sify, CtrlS, and Nxtra. An attributed industry summary reported that these five operators held approximately 66% of capacity.[6] This is an operator-concentration estimate, not evidence that the same companies account for 66% of investment, facilities, revenue, or future additions.
CEEW also highlights a striking international mismatch, citing an estimate that India generates about one-fifth of global data while holding only around 1.2% of global data center capacity.[1] The two percentages come from different concepts: data generation concerns digital activity, while capacity concerns physical infrastructure. Their contrast helps explain expectations of further construction, but it does not by itself prove how many gigawatts India will build.
Policy can influence that conversion from digital demand to operating infrastructure through approvals, power systems, connectivity, and resource planning. For this case study, however, policy is an enabling or constraining context rather than a substitute for the measured capacity record.
The 2030 outlook remains conditional
CEEW synthesizes industry forecasts placing India at approximately 4.5–6.5 GW of data center capacity by 2030.[1] The width of this range is meaningful. Its lower and upper bounds differ by 2 GW, reflecting uncertainty about project delivery, demand, infrastructure availability, and the assumptions used by the underlying forecasts.
A nearer-term JLL projection placed inventory at 2,073 MW by the end of 2027, an 85% increase from its H1 2025 base. JLL associated that expansion with approximately 10.7 million square feet and about US$6.3 billion in requirements.[3] Because these are projected needs, they belong in a forecast paragraph rather than in the historical account of completed capacity.
The evidence consequently supports a strong but bounded conclusion. India entered a measurable data center infrastructure super-cycle, with capacity rising from roughly 520 MW in 2020 to a cluster of estimates around 1.5 GW in 2025. It does not support one timeless, source-free statement of the market’s exact size. Every defensible figure must travel with its source, measurement scope, and observation date.
Study questions
- Why can JLL’s 1,123 MW figure and CBRE’s approximately 1,530 MW figure both be useful without being treated as interchangeable?
- What does the concentration of roughly 90% of capacity in Mumbai, Chennai, Delhi-NCR, and Bengaluru reveal about the geography of India’s build-out?
- Explain the difference between operational capacity, a capacity addition, net take-up, an investment commitment, and a capacity forecast.
- Why would averaging conflicting market estimates produce a less defensible answer?
- Which parts of the 4.5–6.5 GW outlook can be described as evidence, and which remain conditional?
References
- Scaling India’s Data Centre Ecosystem — Council on Energy, Environment and Water
- India’s Data Centre Market in a New Era — CBRE
- India Data Centre Market Dynamics Report H1 2025 — JLL
- India Data Center Market Report Q1 2026 — Blackridge Research, 2026
- India Data Centre Strategic Report 2026 — GRI Institute, 2026
- Data centre industry in India — Wikipedia
Related exhibits & inventory
Verified outcomes
No verified outcomes on file for this exam yet
See Methodology for how outcome evidence is disclosed once logged.
Planners
No planner filed for this exam yet
A downloadable timeline template for this exam hasn't been published yet.
Tool verdicts
AI-tool cautions
No AI tools tested for this exam yet
No hands-on AI-accuracy logs have been filed for this exam.
Questions about this plan
Ask a question about a specific section, timeline, or citation in this plan — or flag something that needs correcting.
Comments
Join the discussion with an anonymous comment.