
GRE Exam Hub
How Houthi Attacks Affect Oil Prices: An Economics AD-AS Study Guide
This guide explains how the Houthi attacks on Red Sea oil tankers affected global oil prices through the AD-AS supply shock model, giving economics students a reusable framework for exam questions on geopolitical oil disruptions.
- gre
- mcat
- asvab
- sat
- act
- digital-adaptive
- official-material
- section-strategy
- test-date-timeline
Last reviewed: July 24, 2026. For an economics exam, the Houthi attacks on Red Sea oil tankers in July 2026 are best classified first, not narrated first: they are a negative supply shock. The disruption raises the cost and risk of moving oil through a strategic chokepoint, oil is a production input for firms across the economy, and higher input costs shift short-run aggregate supply left. In an AD-AS diagram, that means a higher price level and lower real output.
The case has the numbers an exam answer needs. Brent crude moved from about $89 a barrel to above $100 after the July 2026 escalation, and analysts discussed $115–$120 a barrel under a full Bab el-Mandeb blockade scenario.[1][2] The Bab el-Mandeb matters because roughly 4.2 million barrels per day, about 6% of seaborne oil trade, move through it.[3] Those figures are not decoration. They are the reason the diagram is credible.
Start the answer with the shock, not the ships
A strong answer begins by naming the type of shock. The Houthi attacks and blockade threat restrict, delay, or raise the risk premium on oil transport. That is a supply-side disruption to an important input, so the first curve to move in the standard AD-AS model is SRAS, not aggregate demand.
The wording matters. Do not write simply that “oil prices rise, so inflation rises.” That skips the model. Write that oil is used directly in transport and energy, and indirectly through supply chains. When oil becomes more expensive, many firms face higher per-unit production costs. At each level of output, firms now require a higher price to produce the same quantity, so SRAS shifts left.
| Exam move | What to write |
|---|---|
| Classify the event | A geopolitical disruption to oil transport is a negative supply shock. |
| Identify the market channel | Risk around Bab el-Mandeb raises expected or actual oil supply costs. |
| Connect to firms | Oil is a production input, so higher oil prices raise firms’ costs. |
| Move the AD-AS curve | SRAS shifts left while AD is usually held constant in the basic diagram. |
| State the result | The price level rises and real GDP falls: stagflation. |
| Evaluate | Magnitude depends on duration, substitution routes, inventories, policy response, and whether the disruption becomes a full blockade. |
Why Bab el-Mandeb changes the diagram
Bab el-Mandeb is the narrow passage connecting the Red Sea to the Gulf of Aden. For the AD-AS answer, its importance is not geographical trivia. It is a bottleneck in the movement of oil and goods. When a chokepoint becomes riskier, shippers may pay more for insurance, reroute, wait, or avoid the route altogether. Each of those responses can raise the delivered cost of oil.
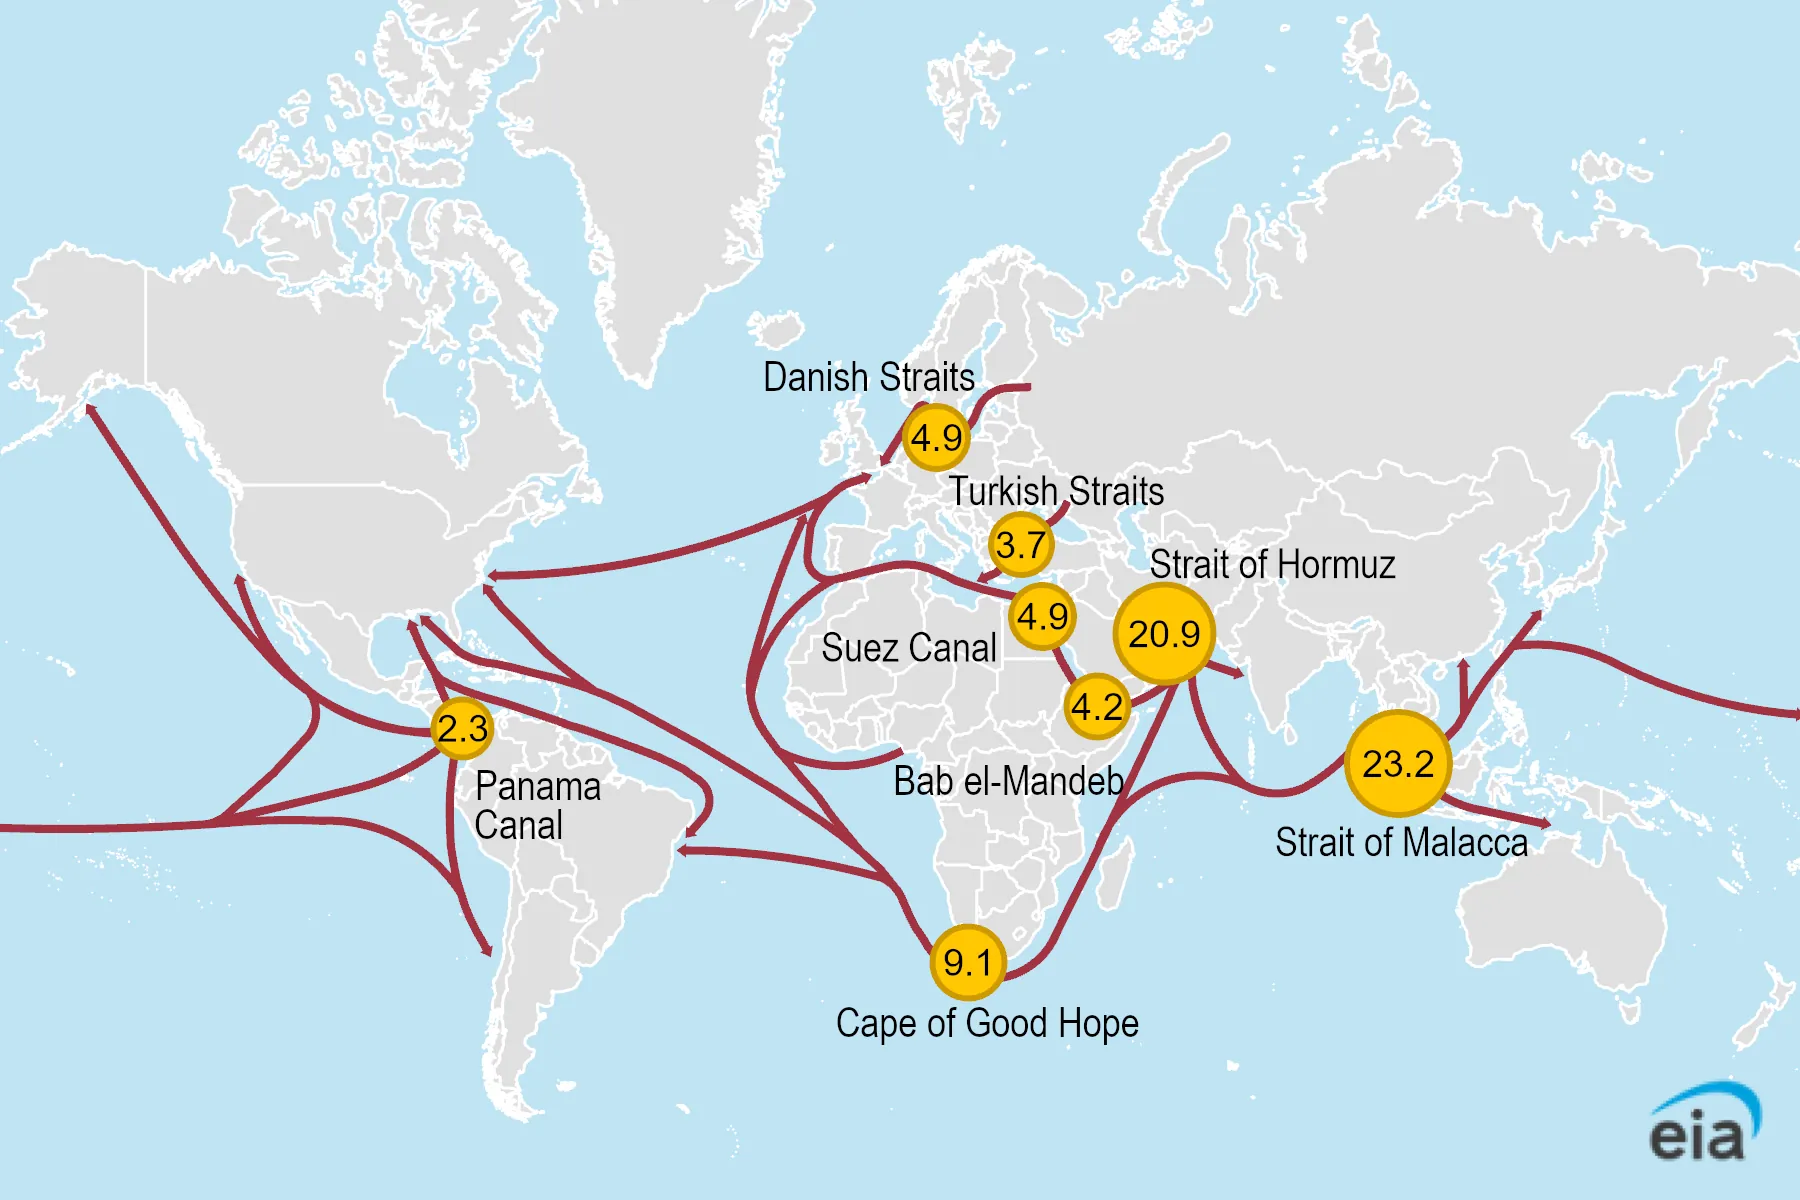
That is why the throughput number is useful in an essay. If roughly 4.2 million barrels per day pass through Bab el-Mandeb, the issue is not only whether one tanker is hit. The economic question is whether traders, insurers, refiners, and shipping firms price in a wider probability of disrupted flows.[3]
A precise sentence would look like this: “Because Bab el-Mandeb carries about 4.2 million barrels per day, attacks near the strait increase expected transport costs and supply risk, raising oil prices and shifting SRAS left.” That sentence does three jobs at once: it uses evidence, identifies a mechanism, and moves the correct curve.
The AD-AS mechanism in full
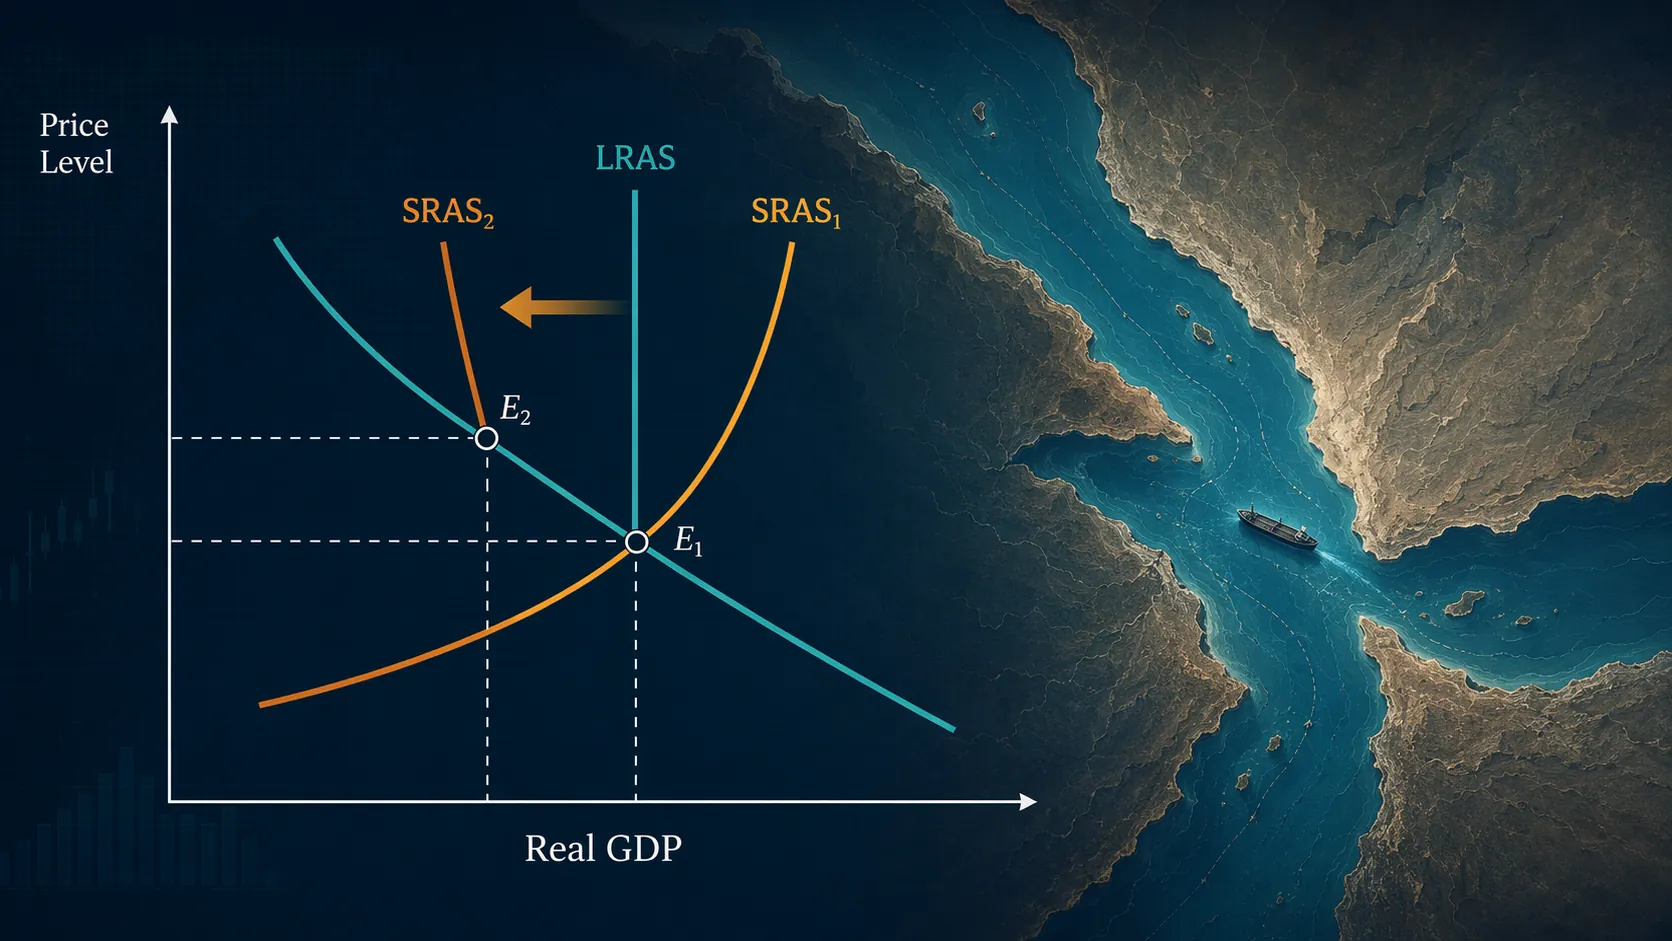
In the short run, the economy has sticky wages and contracts. Firms cannot instantly redesign production, replace energy inputs, renegotiate every delivery contract, or pass through costs evenly. When oil prices jump, firms’ costs rise before the economy has fully adjusted. That is the reason the short-run aggregate supply curve shifts left from SRAS1 to SRAS2.
On the diagram, the original equilibrium is where AD intersects SRAS1. After the shock, SRAS2 intersects AD at a higher price level and lower real GDP. This combination is stagflation: inflationary pressure at the same time as weaker output. The word is useful only if it is attached to the diagram. Higher price level alone is not enough; lower real output is the other half of the result.
- Vertical axis: price level.
- Horizontal axis: real GDP.
- AD slopes downward.
- LRAS is vertical at potential output.
- SRAS shifts left after the oil-cost shock.
- New equilibrium: higher price level, lower real GDP.
Notice what does not need to happen in the basic diagram. Aggregate demand does not have to shift first. Consumers and firms may later change spending because of lower real income, weaker confidence, or tighter monetary policy, but the initial textbook movement comes from costs. In a timed answer, that sequence protects the logic.
Why oil prices can move sharply
Oil is unusually sensitive in the short run because both supply and demand are relatively inelastic. Drivers, airlines, shipping firms, factories, and power users cannot all cut oil use immediately when the price rises. Producers also cannot always add replacement supply instantly. A small expected loss of supply, or even a higher probability of loss, can therefore produce a large price movement.
That is where the geopolitical element strengthens the answer. A 2026 LSE/CFM working paper by Verduzco-Bustos and Zanetti finds that a 1% oil production decline caused by geopolitical shocks raises prices by about 11.5%, a much steeper response than a standard supply shock.[4] The lesson is not that every conflict creates the same oil spike. It is that geopolitical disruptions can change risk expectations quickly, so the price response may be larger than the physical supply loss alone would suggest.
ECB research also supports the idea that geopolitical risk in oil-producing states can raise oil prices through a risk channel, with estimated immediate price increases of 0.8% to 1.5% depending on the shock specification.[5] That is a narrower claim than “war always causes inflation.” It says risk itself can enter prices before a full physical shortage appears.
From crude oil to inflation and output
The oil-price increase reaches the wider economy through several channels. The direct channel is fuel and energy. The indirect channel is production and distribution: firms pay more to transport goods, operate machinery, run fleets, and buy oil-intensive intermediate inputs. Some firms pass those costs to consumers; others absorb them through lower margins; some reduce output or delay expansion.
The inflation estimate gives this paragraph weight. JP Morgan estimated that the Red Sea crisis could add 0.7 percentage points to global core goods inflation, as cited by the Baker Institute in its 2024 analysis of the earlier phase of Houthi Red Sea attacks.[6] That estimate should be used carefully: it refers to the Red Sea crisis context discussed in 2024, not a completed measurement of the July 2026 escalation. Still, it shows the kind of downstream price pressure examiners expect students to explain.
For output, the mechanism is just as important. Higher input costs reduce firms’ willingness or ability to produce at previous prices. Real incomes may fall if consumers spend more on energy and have less left for other goods. If central banks respond to inflation by keeping interest rates tighter than otherwise, demand-sensitive sectors can weaken too. Those later demand effects may appear in a fuller answer, but they should not replace the initial SRAS shift.
The high-mark nuance: large price shock does not automatically mean large macro shock
A basic answer stops after “SRAS shifts left.” A better answer evaluates how far the result can be pushed. Reuters reported that a full Bab el-Mandeb blockade could lift prices toward $115–$120 a barrel, but also noted that workarounds could limit the impact.[1] That matters because rerouting, inventories, alternative suppliers, and strategic reserves can reduce the economy-wide effect even when spot prices jump.
The Dallas Fed counterpoint is the cleanest way to avoid overclaiming. Kilian, Plante, and Richter found that a 20-percentage-point increase in the probability of a geopolitical oil disaster lowers global output by only 0.12%, concluding that geopolitical oil price risk has not been a major driver of global macroeconomic fluctuations historically.[7] That does not cancel the AD-AS diagram. It limits the claim: the model shows the direction of pressure, while empirical evidence raises questions about the size and persistence of the macro effect.
This is the distinction examiners reward. Brent moving above $100 is an oil-market fact. A leftward SRAS shift is the macro model. Lower real output and a higher price level are the predicted short-run direction. The final magnitude depends on duration, substitution, policy response, and whether the threat becomes a sustained physical disruption rather than a temporary risk premium.
Selective disruption makes the case less symmetrical
The Houthi case is also not identical to a universal oil embargo. Baker Institute analysis of the earlier Red Sea attacks argued that the Houthis selectively targeted Israel-linked and Western-linked vessels while allowing Chinese and Russian ships to pass, creating an asymmetric cost burden rather than an equal disruption across all trade.[6] In an essay, that point belongs in evaluation, not in the opening model.
The implication is simple: some firms, countries, and shipping routes may face higher costs than others. That can produce uneven inflation pressure and uneven supply-chain disruption. The basic AD-AS model aggregates the economy, so it smooths over these distributional differences. A high-mark answer can use the model first, then acknowledge that the real-world shock is asymmetric.
Do not confuse this with a demand-driven oil-price rise
Not every increase in oil prices is a negative supply shock. If oil prices rise because global growth is accelerating and factories, consumers, and transport firms demand more energy, the initial story is demand-side. In that case, higher oil prices may accompany rising output rather than falling output, at least at first.
The Houthi case is different because the trigger is a threat to supply routes and transport security. The first-round effect is higher cost and lower effective supply, not stronger global spending. That is why SRAS is the central curve. If an exam prompt asks “how Houthi attacks affect oil prices,” classify the cause before drawing the result.
| Oil-price cause | Likely first diagram move | Typical macro result |
|---|---|---|
| Geopolitical disruption to oil supply or shipping | SRAS shifts left | Higher price level, lower real GDP |
| Stronger global demand for energy | AD may shift right, with derived demand for oil rising | Higher price level, higher real GDP in the short run |
| Temporary risk premium without sustained disruption | Small or short-lived SRAS pressure | Limited macro effect unless the shock persists |
A reusable exam paragraph
Here is a model paragraph that can be adapted for AP Macro, IB Economics, or A-Level Economics:
The Houthi attacks on Red Sea oil tankers in July 2026 can be analyzed as a negative supply shock. Because Bab el-Mandeb carries about 4.2 million barrels per day, disruption or blockade risk raises the expected cost of transporting oil.[3] Brent crude rose from about $89 to above $100 a barrel after the escalation, showing the oil-market response.[1][2] Since oil is a key input for transport and production, higher oil prices increase firms’ costs and shift SRAS left. In the short-run AD-AS model, this raises the price level and lowers real GDP, creating stagflationary pressure. However, the size of the macroeconomic effect depends on the duration of the disruption, possible shipping workarounds, inventories, and policy responses; Dallas Fed research suggests geopolitical oil disaster risk has historically had only modest effects on global output.[7]
That paragraph has the correct order: event, classification, evidence, mechanism, diagram, outcome, evaluation. If time is short, keep that order and compress the wording. Do not spend the first half of the answer retelling the conflict and then rush the curve movement in the final line.
What to include, and what to leave out
- Include the classification: negative supply shock.
- Include the evidence: Brent from about $89 to above $100, Bab el-Mandeb at about 4.2 million barrels per day, and the $115–$120 full-blockade projection.
- Include the mechanism: oil is an input, so higher oil prices raise firms’ production costs.
- Include the diagram result: SRAS shifts left, price level rises, real GDP falls.
- Include evaluation: workarounds, duration, selective targeting, and the Dallas Fed evidence on modest historical macro effects.
- Leave out long military background unless the prompt specifically asks for geopolitical context.
The Houthi attacks are a strong textbook supply-shock case because the chain is visible: threat to a chokepoint, higher oil prices, higher input costs, leftward SRAS shift, stagflationary pressure. The best answer does not pretend the model explains every detail. It uses the model to establish direction, then uses evidence to judge size, persistence, and uncertainty.
References
- Houthi Red Sea blockade would lift oil prices, but workarounds could limit impact. Reuters, July 20, 2026.
- Oil prices leap after Houthi attacks in Red Sea. The Washington Post, July 23, 2026.
- Another Hormuz? The Red Sea's Threat to the Global Economy. Council on Foreign Relations, June 2026.
- Geopolitical oil price shocks: Why these shocks hit harder. LSE Centre for Macroeconomics / CEPR, 2026.
- Geopolitical risk and oil prices. European Central Bank, Economic Bulletin Issue 8/2023.
- Houthi Red Sea Attacks Impose 'Economic Sanctions' on Israel's Backers. Baker Institute, 2024.
- Geopolitical oil price risk not a major driver of global macroeconomic fluctuations. Federal Reserve Bank of Dallas, 2025.
Related exhibits & inventory
Verified outcomes
Planners
No planner filed for this exam yet
A downloadable timeline template for this exam hasn't been published yet.
Tool verdicts
AI-tool cautions
No AI tools tested for this exam yet
No hands-on AI-accuracy logs have been filed for this exam.
Questions about this plan
Ask a question about a specific section, timeline, or citation in this plan — or flag something that needs correcting.
Comments
Join the discussion with an anonymous comment.