
MCAT Exam Hub
What Is a Heat Dome? Weather Pattern Explained for Students
A clear, exam-ready science explainer on the heat dome weather pattern — how it forms, why it produces extreme heat, and how understanding the mechanism helps students tackle atmospheric science passages on the MCAT, ACT, SAT, and GRE.
- gre
- mcat
- asvab
- sat
- act
- digital-adaptive
- official-material
- section-strategy
- test-date-timeline
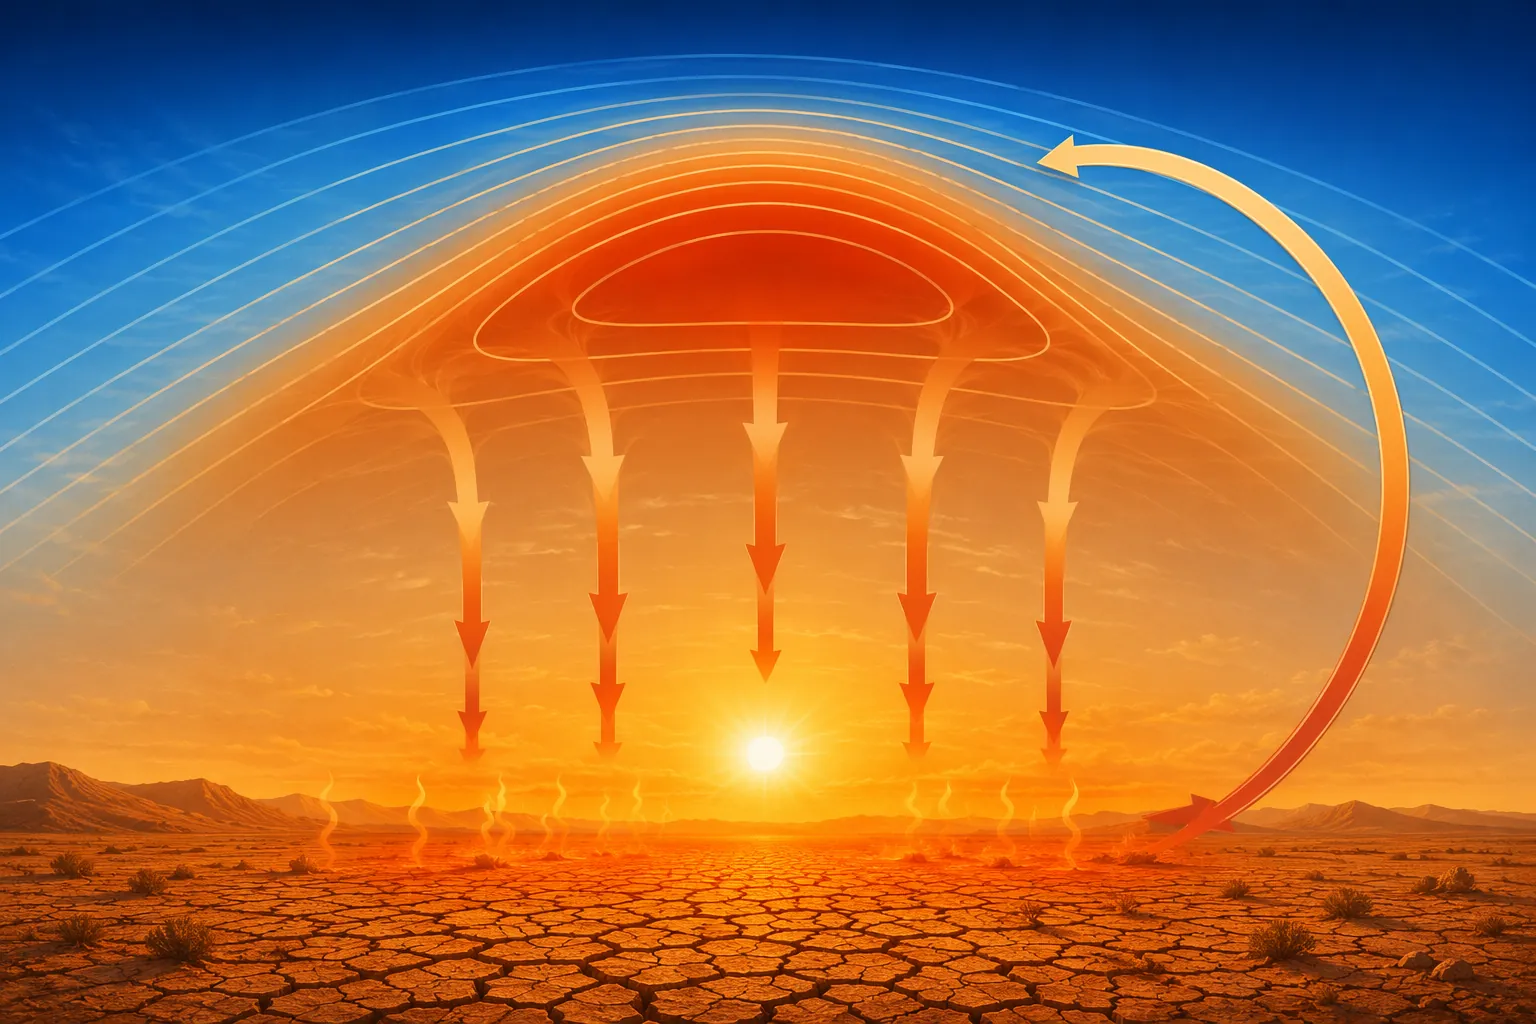
A heat dome is not just a hotter-than-normal day. It is the atmospheric setup that can produce many hotter-than-normal days in a row: a persistent high-pressure ridge in the upper atmosphere, sinking air beneath it, fewer clouds, stronger surface heating, and feedback that keeps the pattern going.
For exam purposes, keep the cause and the effect separate. The heat dome is the pattern. The heat wave is the surface-temperature outcome people experience. News headlines often blur the two, but a passage question may not.
The Mechanism, Not the Metaphor
The word “dome” is useful only if it helps you picture persistence. There is no solid lid in the sky. The important feature is a broad, slow-moving high-pressure ridge aloft. Under that ridge, air tends to sink. As the air descends into higher pressure near the surface, it compresses and warms. Meteorologists describe this as adiabatic warming, and a useful dry-air estimate is about 10°C of warming for each kilometer of descent.[1]
That one number is worth more than a dozen dramatic headlines. If a passage says air is subsiding, the next step is not “air is trapped” in a vague sense. The next step is compression. Compression raises temperature. Warmer sinking air also discourages rising motion from the surface, so ordinary afternoon convection is weaker. With less vertical mixing and fewer clouds, more solar radiation reaches the ground.[1][2]
A typical heat-dome sequence looks like this:
- The jet stream slows, bends, or stalls into a blocking pattern.
- An upper-level ridge of high pressure parks over a region.
- Air beneath the ridge sinks, compresses, and warms.
- Sinking air suppresses cloud formation and reduces convection.
- More sunlight reaches the surface, heating land, roads, buildings, and vegetation.
- Soils dry out, so less incoming energy is spent evaporating water.
- The hotter, drier surface reinforces the hot high-pressure pattern above it.
The last two steps are where many students lose the passage. Wet soil can cool the surface through evaporation, because some incoming energy goes into changing liquid water into water vapor. Dry soil cannot spend as much energy that way. More of the Sun’s energy remains as sensible heat, the kind that raises surface and near-surface air temperature. That is why a heat dome can intensify after several dry, cloudless days rather than simply repeat the same hot afternoon.
This is also why “hot air gets trapped” is an incomplete explanation. It skips the mechanism that exam questions like to test: pressure changes, vertical motion, temperature change, cloud suppression, radiation, soil moisture, and feedback.
How Blocking Turns Weather Into a Multi-Day Pattern
A single hot afternoon does not require a heat dome. A heat dome becomes plausible when the atmosphere stops moving systems along at the usual pace. Many descriptions point to a stalled jet stream or an omega block, a pattern named because the flow resembles the Greek letter omega. In that setup, a ridge of high pressure sits between troughs, and the whole arrangement can resist eastward movement.[1][2]
Once the ridge is stationary, the same place receives the same kind of atmospheric treatment day after day. Sinking air continues. Clouds remain limited. Surface heating accumulates. Overnight lows may stay unusually high, especially in urban areas where pavement and buildings release stored heat slowly. If a passage mentions persistent overnight lows, treat that as a clue about heat stress and accumulated heat, not just daytime sunshine.
Heat domes can be large and long-lived. AP has described them as stretching over 1,000 miles, pushing temperatures 30°F above seasonal averages, and lasting from several days up to two weeks.[3] Those figures are not definitions; they are scale reminders. The definition is still the pressure pattern and its feedbacks.
| Term in a passage | What to translate it into |
|---|---|
| Upper-level ridge | High pressure aloft; likely sinking air below |
| Blocking high | A high-pressure system that stays in place and slows pattern movement |
| Omega block | A stalled jet-stream configuration that can hold a ridge over one region |
| Subsidence | Sinking air; expect compression and warming |
| Reduced convection | Less rising air; fewer clouds and storms |
| Temperature anomaly | Departure from the usual temperature for that place and season |
| Persistent overnight lows | Heat is not being released enough at night; risk and accumulated heat increase |
Heat Dome vs. Heat Wave
A heat wave is usually defined by prolonged abnormal heat at the surface. The exact threshold varies by region and agency, because “extreme” depends on local climate and public-health context. A heat dome, by contrast, names the atmospheric pattern that can cause or intensify a heat wave: a persistent high-pressure ridge with sinking, warming air and suppressed cloud formation.[4]
That distinction matters in reading questions. If the answer choice says “the heat wave caused the high-pressure ridge,” be careful. In the mechanism described here, the ridge is upstream in the causal chain. Surface heating can reinforce the ridge later, but the original sequence begins with the atmospheric circulation pattern.
The term “heat dome” itself is not a formal scientific category in the way “high-pressure ridge” or “blocking pattern” is. Sources aimed at the public use it because it is memorable.[4][5] An exam passage may avoid the phrase entirely and still describe the same mechanism.
A Real Case: The 2021 Pacific Northwest Event
The 2021 Pacific Northwest heat dome is useful because it shows how far the mechanism can push a region away from normal expectations. Lytton, British Columbia reached 121°F, or 49.6°C, exceeding Canada’s previous national record by 8°F, or 4.4°C.[6] Grist described the event as extreme enough to shift scientists’ sense of what was physically possible in that climate region.[7]
For a student, the lesson is not to memorize Lytton as trivia. The lesson is that a pressure pattern can create a large departure from historical experience when several mechanisms line up: blocked movement, subsidence, adiabatic warming, limited clouds, dry surfaces, and feedback. If a graph in a passage shows a sharp positive temperature anomaly during a stagnant high-pressure period, the question is probably asking you to connect those links.
Why Students Are Seeing This Topic Now
The term has stayed visible because recent summers have supplied obvious examples. Severe Weather Europe reported that a July 2026 U.S. heat-dome event affected more than 200 million Americans, with heat indices above 110°F in some areas.[8] Weather.com described dangerous overnight lows that failed to fall below about 75–80°F in urban areas during the same broad pattern.[9]
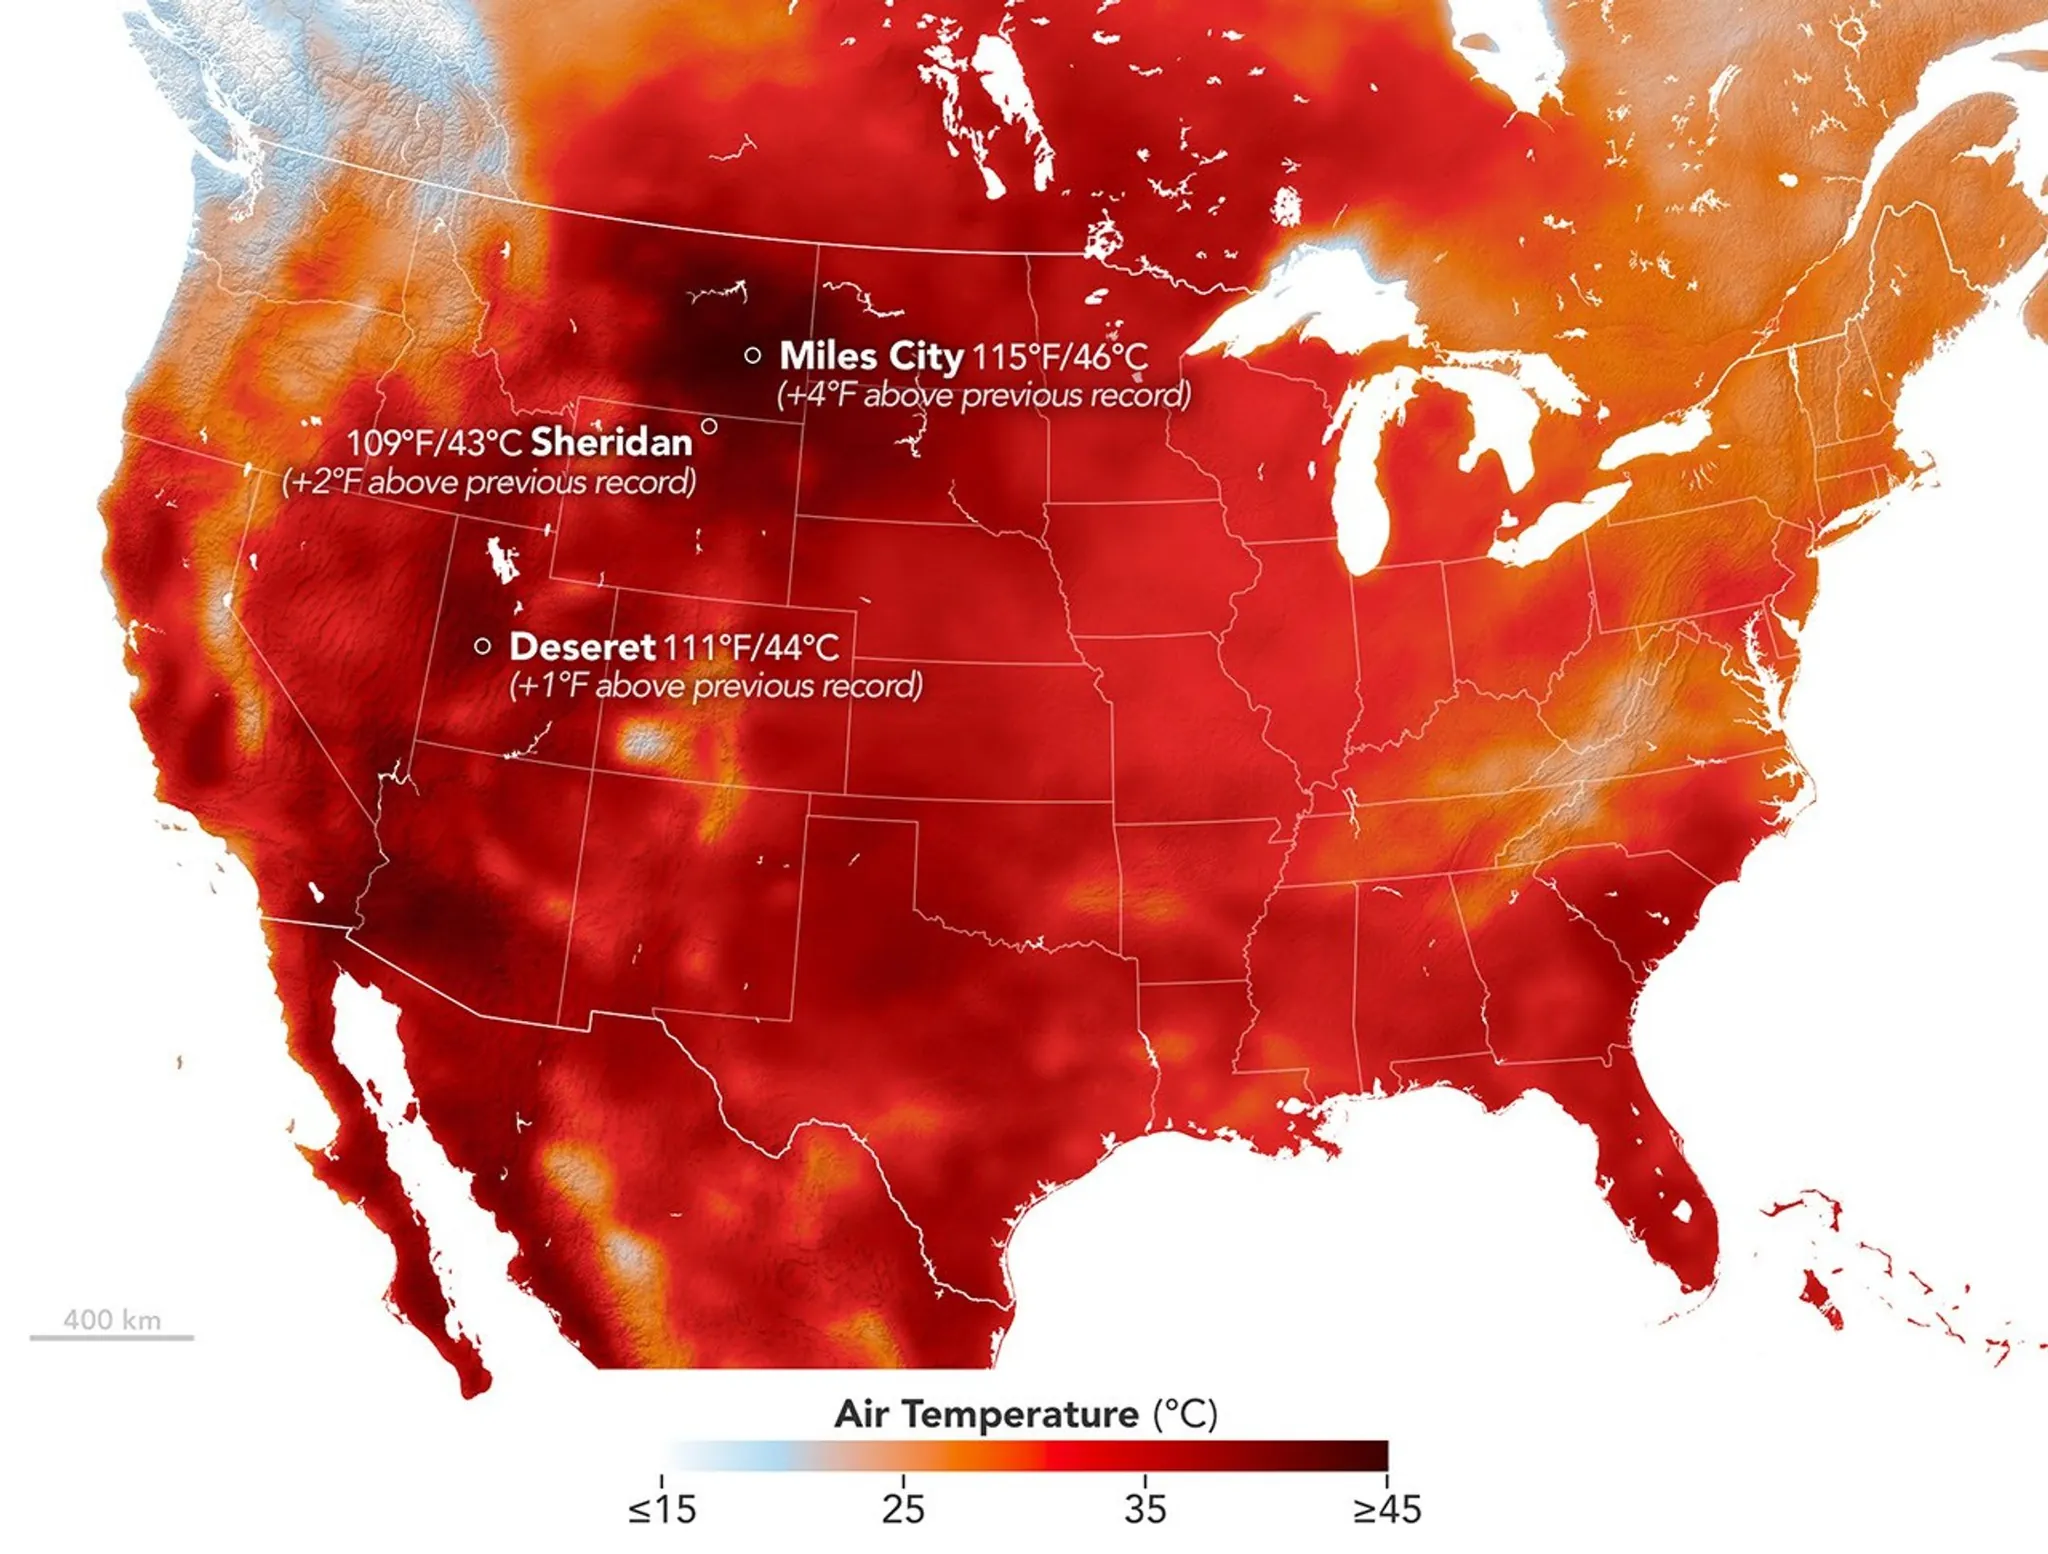
Use those current-event figures carefully. They help explain why the topic feels timely, but they come from weather reporting rather than from the basic physics. The mechanism does not depend on one summer’s headline.
There is also a broader trend in the background. EPA data discussed by The Conversation shows that heat-wave frequency in U.S. cities rose from an average of 2 per year in the 1960s to 6 per year in the 2020s.[1] That does not mean every heat dome has the same cause, and it does not turn every passage into a climate-change passage. It does mean extreme-heat examples are natural material for exams that like contemporary science.
One climate-related idea needs especially careful wording. A leading hypothesis argues that Arctic amplification may weaken the temperature contrast that helps steer the jet stream, encouraging a more meandering flow and more blocking patterns. Ohio University identifies omega blocks and other atmospheric terms as part of recent heat-dome discussions, but the specific jet-stream connection remains an active research area, not a settled shortcut for every event.[10]
How This Shows Up on Exams
Standardized exams rarely reward you for knowing the phrase “heat dome” by itself. They reward you for tracking cause and effect under unfamiliar wording. A passage might talk about an upper-level anticyclone, a ridge, subsidence, blocked flow, geopotential height anomalies, suppressed convection, or unusually warm nighttime minimums. The same machine still runs underneath.
For MCAT CARS or GRE Verbal, the danger is usually conceptual overreach. If an author says a heat dome is associated with a stalled jet stream, do not choose an answer claiming the article proved all heat waves are caused by climate change. If a passage describes a debated hypothesis, keep it debated. Verbal questions often test scope more than vocabulary.
For ACT Science or a data-heavy SAT passage, the danger is skipping the axes. A temperature-anomaly graph does not show absolute temperature unless the axis says so. A lapse-rate question may ask what happens to a descending air parcel; the expected direction is warming with descent, not cooling. A cloud-cover graph may function as a radiation clue: fewer clouds usually mean more incoming solar energy during the day.
| If the passage gives you... | Ask yourself... |
|---|---|
| A map of high pressure parked over a region | Is the system persistent enough to create multi-day heating? |
| Downward arrows or the word “subsidence” | What happens to air as it descends and compresses? |
| Clear skies during the event | How does reduced cloud cover change incoming solar radiation? |
| Dry soil or drought conditions | Is less energy being used for evaporative cooling? |
| High nighttime minimum temperatures | Is heat accumulating because nights are not resetting the surface? |
| A claim about jet-stream changes | Is the passage presenting a settled conclusion or a hypothesis? |
A Compact Passage-Reading Checklist
When a heat-dome or extreme-heat passage appears, read for sequence before you read for drama:
- Separate cause from effect: high-pressure pattern first, surface heat wave second.
- Translate “subsidence” into sinking, compressing, warming air.
- Connect fewer clouds to stronger daytime surface heating.
- Treat dry soil as a reduced evaporative-cooling clue.
- Watch for feedback: hot, dry surfaces can help maintain or intensify the pattern.
- Keep climate claims at the exact strength the passage supports.
If you are building this into broader test prep, route the skill back to your exam plan rather than treating weather as a separate trivia unit. Start with the MCAT, ACT, SAT, and GRE exam hubs and practice the same habit across passages: identify the mechanism, preserve the author’s scope, and answer the question actually asked.
References
- What is a heat dome? A meteorologist explains the weather phenomenon baking large parts of the US, The Conversation
- How a heat dome is formed and why experts blame one for Europe’s baking temperatures, PBS NewsHour
- What is a heat dome?, AP News
- What Is a Heat Dome?, ClimateCheck
- What is a heat dome?, National Geographic
- Heat Dome, UC Davis
- The science behind the heat dome: A mosh pit of molecules, Grist
- Historic Heat Dome and Heatwave across the United States around Fourth of July, Severe Weather Europe
- Heat Dome: Explaining This Deadly Weather Pattern, Weather.com
- Heat domes, atmospheric rivers, omega blocks: Explaining what these other weather terms mean, Ohio University
Related exhibits & inventory
Verified outcomes
Planners
No planner filed for this exam yet
A downloadable timeline template for this exam hasn't been published yet.
Tool verdicts
Questions about this plan
Ask a question about a specific section, timeline, or citation in this plan — or flag something that needs correcting.
Comments
Join the discussion with an anonymous comment.