
Comparison
Predicting SpaceX Stock: 4 Methods Every Student Should Know
Learn four methods analysts use to predict stock prices, using SpaceX as a real-world case study. This guide explains how each method works, why they give different results, and which method to trust when studying a volatile stock like SPCX.
Verdict panel
- Compared
- not specified
- Target exam
- not specified
- Best for
- not specified
- Pricing last reviewed
- pricing currency unconfirmed
SpaceX is almost too good as a classroom example. It is famous enough that nobody has to be persuaded to care, and volatile enough that the first question students ask is usually the dangerous one: “So what is the correct price?”
As of July 21, 2026, the public stock, SPCX, has already given students a full semester of valuation confusion in about five weeks. The IPO was priced at $135, with SpaceX raising $75 billion through a fixed-price offering rather than the usual price-range process.[1] The stock then ran toward about $225.64 before falling back toward roughly $124, while published analyst targets stretched from $63 to $227.[2] Those numbers are not small disagreements. They are different stories about the same company.
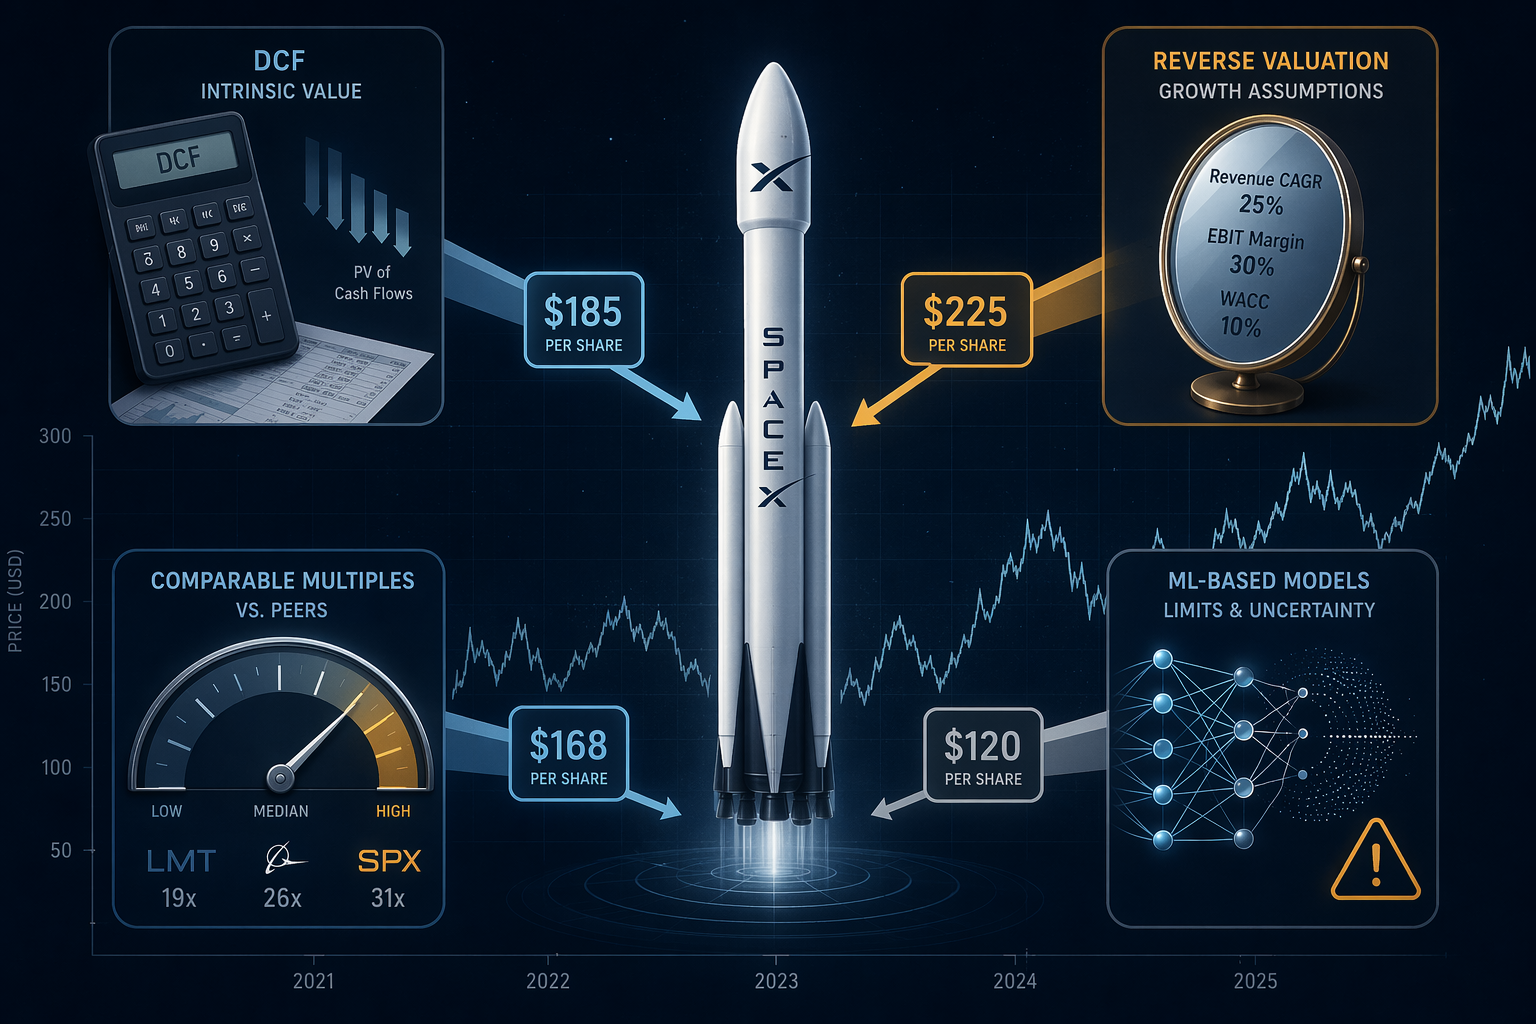
This article is a SpaceX stock price prediction study for students, not a recommendation to buy, sell, or avoid SPCX. The goal is to learn four methods analysts use: discounted cash flow, comparable multiples, reverse valuation, and machine learning pattern recognition. Each method answers a different question. None of them is a crystal ball.
Start With The Gap, Not The Answer
A beginner naturally wants the model to produce one clean number. SPCX refuses to cooperate. Morningstar’s probability-weighted discounted cash flow target was $63, while Aswath Damodaran’s DCF work came out around $100 per share, and the market briefly paid more than twice that.[2][3] If a student treats any one of those as “the prediction,” the lesson is already going wrong.
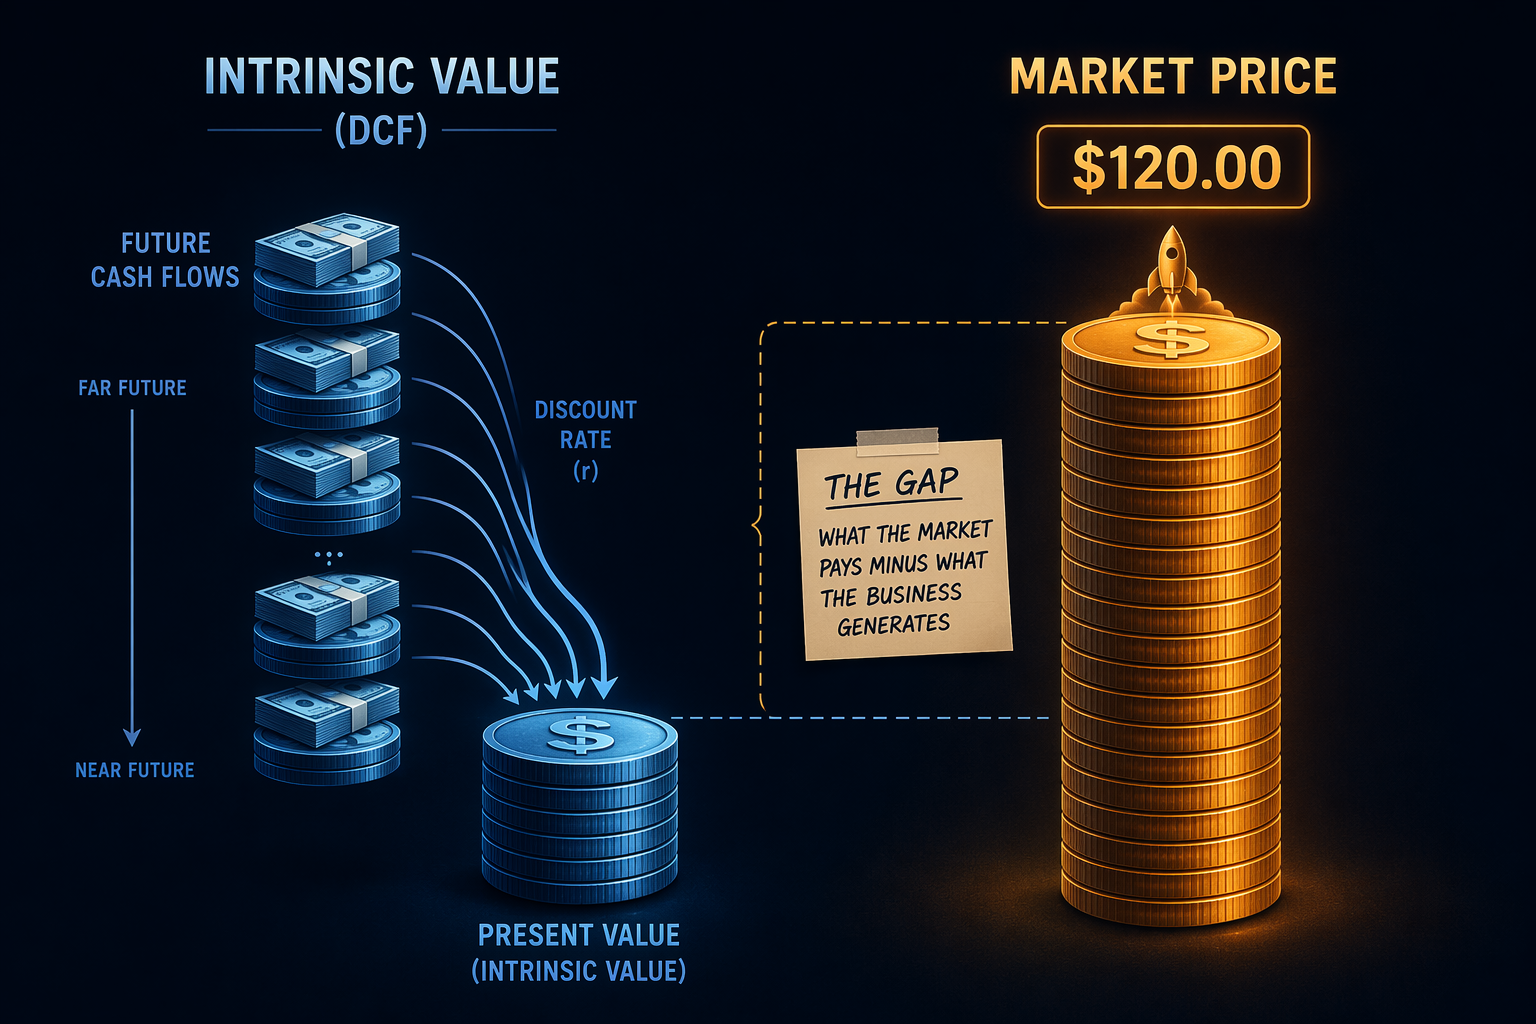
A better first move is to ask what each number is measuring. A DCF number tries to estimate the present value of future cash flows. A market price reflects what buyers and sellers are willing to exchange today, including scarcity, index mechanics, excitement, fear, and the possibility that the future will be larger than conservative models allow. An analyst target can be a blend of scenarios, probability weights, and judgment. These are related, but they are not the same object.
| Method | Student Question | What It Is Really Testing |
|---|---|---|
| Discounted cash flow | What is the business worth? | Future cash flows, risk, discount rate, and terminal assumptions |
| Comparable multiples | What are similar companies priced at? | Peer selection and market mood around the chosen peer group |
| Reverse valuation | What must investors be assuming? | The growth needed to justify today’s price |
| Machine learning | What patterns can historical data detect? | Feature quality, training data, and whether the market structure is stable enough to learn from |
DCF: Estimate The Business Before Staring At The Stock Chart
Discounted cash flow, or DCF, is the method students usually meet first because it has a satisfying structure. Forecast the company’s future cash flows, discount them back to today, adjust for risk, divide by shares, and there is the value. The spreadsheet looks calm. The company rarely is.
Damodaran’s SpaceX model is useful because it does not hide the moving parts. His valuation used an 8.37% cost of capital and modeled the company across three business lines, producing an estimate of roughly $100 per share.[3] That does not mean SpaceX is “really” worth exactly $100. It means that, under that set of revenue, margin, risk, and growth assumptions, the cash flows translate into a present value near that number.
Morningstar’s probability-weighted DCF target of $63 is even more conservative, and it matters because it forces a student to see how scenario weighting changes the output.[2] If a model gives heavy weight to cases where parts of the business scale more slowly, the target will sit far below a price that assumes everything compounds quickly. The important difference is not that one analyst is brave and another is timid. It is that their futures are not the same future.
Suppose the market price is near $225 and one DCF says $100. The useful classroom question is not “Which number wins?” It is: what is inside the extra $125? Some of it may be confidence that launch, Starlink, defense, or future platform businesses grow faster than modeled. Some of it may be scarcity from limited tradable shares. Some of it may be investors paying for an Elon Musk-led company whose past surprises make cautious estimates look stale very quickly. A DCF does not eliminate those beliefs; it makes students write them down.
That is why DCF is the best first method for a student. It slows the conversation. Instead of saying “SpaceX is a great company,” the model asks for revenue by segment, operating margins, reinvestment needs, capital costs, and risk. Instead of saying “the stock is expensive,” it asks expensive relative to which cash-flow path.
How To Read A DCF Output Without Worshiping It
- Find the revenue segments first; a single company-wide growth rate can hide the actual argument.
- Check the discount rate; a lower cost of capital usually lifts the valuation before any operating improvement appears.
- Separate operating assumptions from market assumptions; one belongs in the business forecast, the other explains the price gap.
- Change one assumption at a time; if a small margin or terminal-growth change moves the value dramatically, say so.
- Write the implied story in words; if the story sounds vague, the spreadsheet has become decoration.
Comparable Multiples: The Peer Group Does More Work Than It Admits
Comparable multiples feel easier than DCF because they avoid ten-year forecasts. Pick similar companies, calculate a ratio such as price-to-sales, apply it to the target company, and estimate value. The method is fast. Its weakness is also fast: the answer can change dramatically when the peer group changes.
SPCX has been cited around 94 times trailing revenue. That looks lower than Rocket Lab at 131 times, but far above Tesla at 17 times and Apple at roughly 8 times.[5] The same SpaceX revenue can therefore look cheaper than a space peer, expensive next to an electric-vehicle and AI-adjacent celebrity stock, and extremely expensive next to a mature technology giant.
| Comparison Choice | Why A Student Might Choose It | What The Choice Smuggles In |
|---|---|---|
| Rocket Lab | Closest public space-launch comparison | A belief that launch and space infrastructure are the right market category |
| Tesla | Founder association, growth-stock culture, technology ambition | A belief that investors may price Musk-led platforms in a similar way |
| Apple | Large-cap technology benchmark | A reminder of how different mature cash-generating companies trade |
This is the useful irritation of multiples. They look objective because the arithmetic is simple, but the judgment enters before the math begins. Is SpaceX mainly a launch company, a satellite communications company, a defense contractor, a consumer internet infrastructure company, an AI-adjacent platform, or something investors have not categorized cleanly yet? A multiple cannot answer that. It only reflects the category the analyst chose.
For students, multiples are best used as a market-temperature check. If DCF says one thing and peer multiples say another, do not average them lazily. Ask why public investors are rewarding one category more than another. The peer set is not a footnote; it is the argument.
Reverse Valuation: Ask What Has To Be True
Reverse valuation is often the method students remember because it turns the usual question around. Instead of asking, “What is SpaceX worth?” it asks, “What would SpaceX have to become for this price to make sense?” That shift is healthy. It stops the model from pretending to know the future and starts using the current price as evidence of investor expectations.
One reverse-DCF style exercise frames the problem this way: to justify about a $2.6 trillion market capitalization at a 30 times multiple, SpaceX would need roughly $87 billion in revenue by 2030.[3] That is not a forecast to accept automatically. It is a hurdle. If a student thinks the current market price is reasonable, the next job is to explain how the company reaches the revenue base, margins, and risk profile needed to clear it.
This is also where the most aggressive AI assumptions need careful handling. Goldman Sachs projected xAI alone could reach around $470 billion, a roughly 100-fold growth assumption cited in available reports.[4] Damodaran criticized a $26 trillion AI total-addressable-market assumption as “hallucination,” which is a memorable word because it points at the real danger: a model can become a spreadsheet-shaped wish if the market size expands just enough to rescue the valuation.[3]
Still, the point is not to laugh at big numbers. Ambitious companies sometimes make cautious analysts look painfully slow. A student should not dismiss a large implied revenue target simply because it is large. The better test is whether each step has a plausible bridge: customers, pricing, capacity, regulation, capital spending, competition, and time.
Reverse valuation is especially helpful for SPCX because the analyst spread is so wide. The $63-to-$227 range is not just a disagreement about next quarter. It is a disagreement about what kind of company SpaceX becomes, how much optionality belongs in the stock today, and how much of that optionality should be discounted because it is still uncertain.[2][6]
A Simple Reverse-Valuation Exercise
- Start with the current market price or market capitalization.
- Choose the future year you want to test, such as 2030.
- Pick a future multiple, and state why that multiple fits the company you imagine SpaceX becoming.
- Solve for the revenue or earnings needed to justify the current price.
- Write the operating story that would have to happen between now and that future year.
The answer does not need to be elegant. In fact, the roughness is useful. If the required future sounds impossible, the current price may be pricing too much. If it sounds possible but extremely demanding, the stock may be pricing excellence rather than merely success. If it sounds easy, check the inputs; public markets rarely leave famous stories that easy for long.
Machine Learning: Pattern Recognition Under Stress
Machine learning enters the conversation because many students who are curious about stocks are also curious about code. Regression models, random forests, and LSTM neural networks can use historical prices, volume, technical indicators, and other features to detect patterns that a human might miss.[7] In a stable data environment, that can be useful.
SPCX is not a stable data environment yet. The stock had only about five weeks of trading history by July 21, 2026, and it jumped 67% in 48 hours after the IPO.[2] A time-series model trained on so little company-specific data is not learning a durable rhythm. It is mostly watching a very loud entrance.
The market structure matters too. Public reports point to a float of about 4%, Nasdaq 100 inclusion mechanics, and BNP Paribas estimates of forced buying as part of the post-IPO move.[2] That is exactly the kind of situation where students should be careful with model confidence. A supply shock can move a price before there is enough ordinary trading behavior for the algorithm to learn from.
This does not make machine learning useless. It changes the assignment. For SPCX, a student ML project should probably focus on features and limitations rather than an impressive target price. Which variables might matter once more data exists? Daily volume, float changes, index inclusion effects, analyst coverage dates, earnings surprises, launch cadence, segment revenue disclosures, and broader growth-stock sentiment could all become candidates. The model’s first lesson is humility about the training set.
Why The Four Methods Disagree
The disagreement among methods is not a bug in finance education. It is the education. DCF asks for cash flows and risk. Multiples ask what the market pays for companies that seem comparable. Reverse valuation asks what the current price already assumes. Machine learning asks what patterns appear in the data. If those methods give different answers for SpaceX, they are probably seeing different parts of the elephant.
The most important boundary is the date. These facts are current as of July 21, 2026. The stock is newly public, the price has moved quickly, and major underwriting banks such as Goldman Sachs, Morgan Stanley, and JPMorgan remain in their mandatory quiet period. When their coverage begins, consensus numbers may change. A student model should therefore include a date stamp, not because date stamps look professional, but because predictions decay.
In practice, analysts blend methods. They may build a DCF, check it against multiples, use reverse valuation to test market expectations, and watch trading patterns for timing or risk. The four-method framework is a learning map, not a law of nature.
A Student Exercise Before The First Earnings Report
The first earnings report on September 2, 2026 gives students a useful checkpoint. Pick one method before that date, apply it with public data, and write the assumptions plainly enough that another student can critique them. The goal is not to be the person who guessed the closing price. The goal is to know exactly why the estimate came out where it did.
- Choose one method: DCF, comparable multiples, reverse valuation, or machine learning.
- Record the SPCX price and the date you started.
- List the public data you used, such as revenue segments, peer-company multiples, analyst targets, or trading history.
- Write one price estimate and three assumptions that drive it.
- After the September 2 report, compare the result with the new information, not just the stock move.
A DCF student should explain the cash-flow path. A multiples student should defend the peer group. A reverse-valuation student should state what future the current price requires. A machine-learning student should describe the features, the training window, and why the model may fail. That is more useful than four students shouting four target prices across the room.
For a volatile stock like SpaceX, the strongest student is not the one who trusts one number most loudly. The strongest student learns which version of the future each number is pricing.
References
- SpaceX raises $75 billion in fixed-price IPO, Reuters
- SpaceX Stock Tumbles After Post-IPO Surge, Investopedia
- Revisiting the SpaceX Valuation, Aswath Damodaran’s Substack
- Musk’s SpaceX journey from 10% success probability to $2 trillion valuation, CNBC
- SpaceX Stock Price Prediction, The Motley Fool
- SpaceX Share Price Target and Analyst Forecast, INDmoney
- Stock Price Prediction Using Machine Learning, Simplilearn
Back to the exam this applies to
Target exam not specified — see all exam hubs.
Comments
Join the discussion with an anonymous comment.